Flowchart What is Flowchart
A Flowchart is a graphically representation of the process, algorithm or the step-by-step solution of the problem. The Flowcharts diagrams are widely used for designing, documenting, analyzing and managing the complex processes and programs in various fields such as business, analytics, engineering, architecture, science, manufacturing, administration, etc.
The Flowcharts have one or more starting and ending points. The geometric figures on the Flowcharts represent the steps of the process and are connected with arrows that show the sequence of the actions. The Flowcharts can be orientated vertically or horizontally.

Example 1. VQuad-HD, Flowchart
This sample shows the Flowchart of the VQuad-HD.
TEN RELATED HOW TO's:
ConceptDraw Arrows10 Technology - This is more than enough versatility to draw any type of diagram with any degree of complexity.
Picture: ConceptDraw Arrows10 Technology
Imagine the diagram which is looking smart. That is how ConceptDraw Arrows10 Technology or Smart connectors work.
Thanks to auto-routing feature connectors flow around objects. But if you want some background objects that the connectors flow through - that is also possible to do.
Picture: ConceptDraw Arrows10 Technology
Flowcharts can be used in designing and documenting both simple and complex processes or programs and, similar to the other types of diagrams, they can help visualize what happens and so help understand some definite process, and, as a result, find flaws, bottlenecks and other features within it.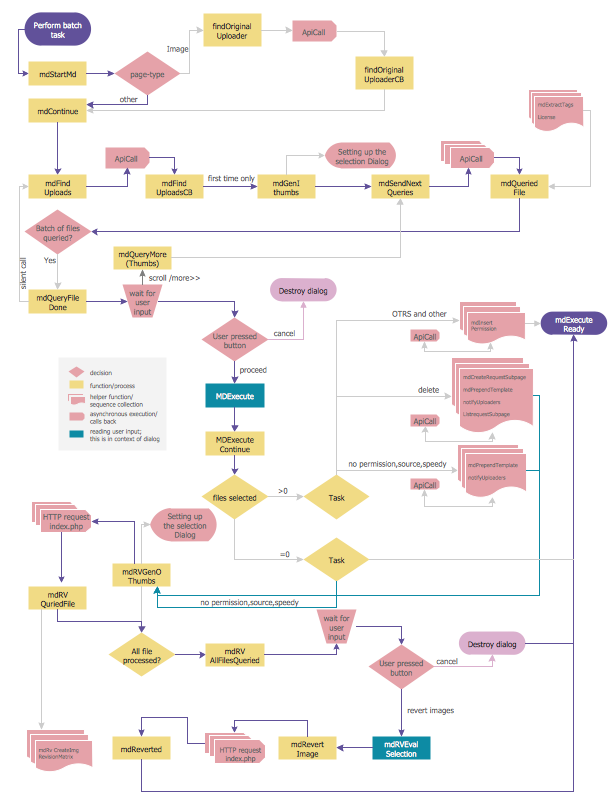
Picture: Flowchart Programming Project. Flowchart Examples
Related Solution:
Every good manager has to predict different situations that might occur in any process. If only every of them Swot Analysis Examples at that time, I could have succeeded in my career. Unfortunately I didn't have any notion about it.
This is a sample of SWOT diagram. This is also a mean of marketing strategy elaboration. Before as filling this table, marketing manager has to investigate both external and internal factors. The effective SWOT analysis helps to gain benefits from opportunities and decrease threats by conversion of strengths and weaknesses into advantage. The SWOT and TOWS Analysis solution to ConceptDraw offers a number of template matrices for SWOT, designed to support a marketing strategy development process.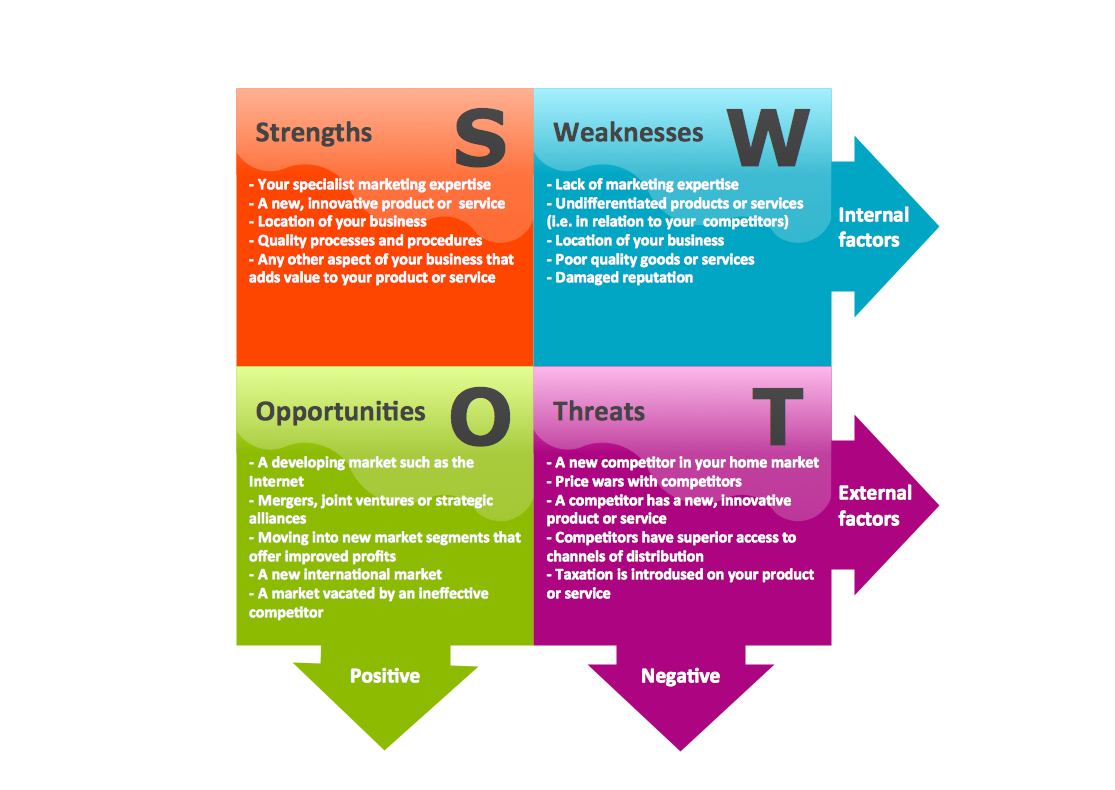
Picture: Swot Analysis Examples
A process flow diagram (PFD) is a diagram commonly used in chemical and process engineering to indicate the general flow of plant processes and equipment.
ConceptDraw DIAGRAM diagramming and vector drawing software extended with Flowcharts Solution from the Diagrams Area of ConceptDraw Solution Park offers the extensive drawing tools for quick and easy design professional looking Process Flow Diagrams.
Picture: Process Flow Diagrams
Related Solution:
The use of the special software with Plant Design Solutions is a real help for effective creating the Plant Plan, Plant Layout Plan, Process Plant Layout, Plant Design. ConceptDraw DIAGRAM is the best diagramming and vector drawing software. It offers the Plant Layout Plans Solution from the Building Plans Area for achievement this goal.
Picture: Plant Design Solutions
Related Solution:
Relative value is a value measured in the terms of liquidity, risks, return of one investment or financial instrument relative to another.
Relative values are widely used in:business, economics, investment, management, marketing, statistics, etc.
ConceptDraw DIAGRAM software is the best for drawing professional looking Relative Value Charts. ConceptDraw DIAGRAM provides Divided Bar Diagrams solution from the Graphs and Charts Area of ConceptDraw Solution Park.
Picture: Relative Value Chart Software
Related Solution:
An onion diagram is a kind of chart that shows the dependencies among parts of an organization or process. The chart displays items in concentric circles, where the items in each ring depend on the items in the smaller rings. The Onion Diagram is able to show layers of a complete system in a few circles.
But how to create Onion Diagram? Now, it's very easy thanks to the ConceptDraw DIAGRAM diagramming and vector drawing software extended with Stakeholder Onion Diagrams Solution from the Management Area of ConceptDraw Solution Park.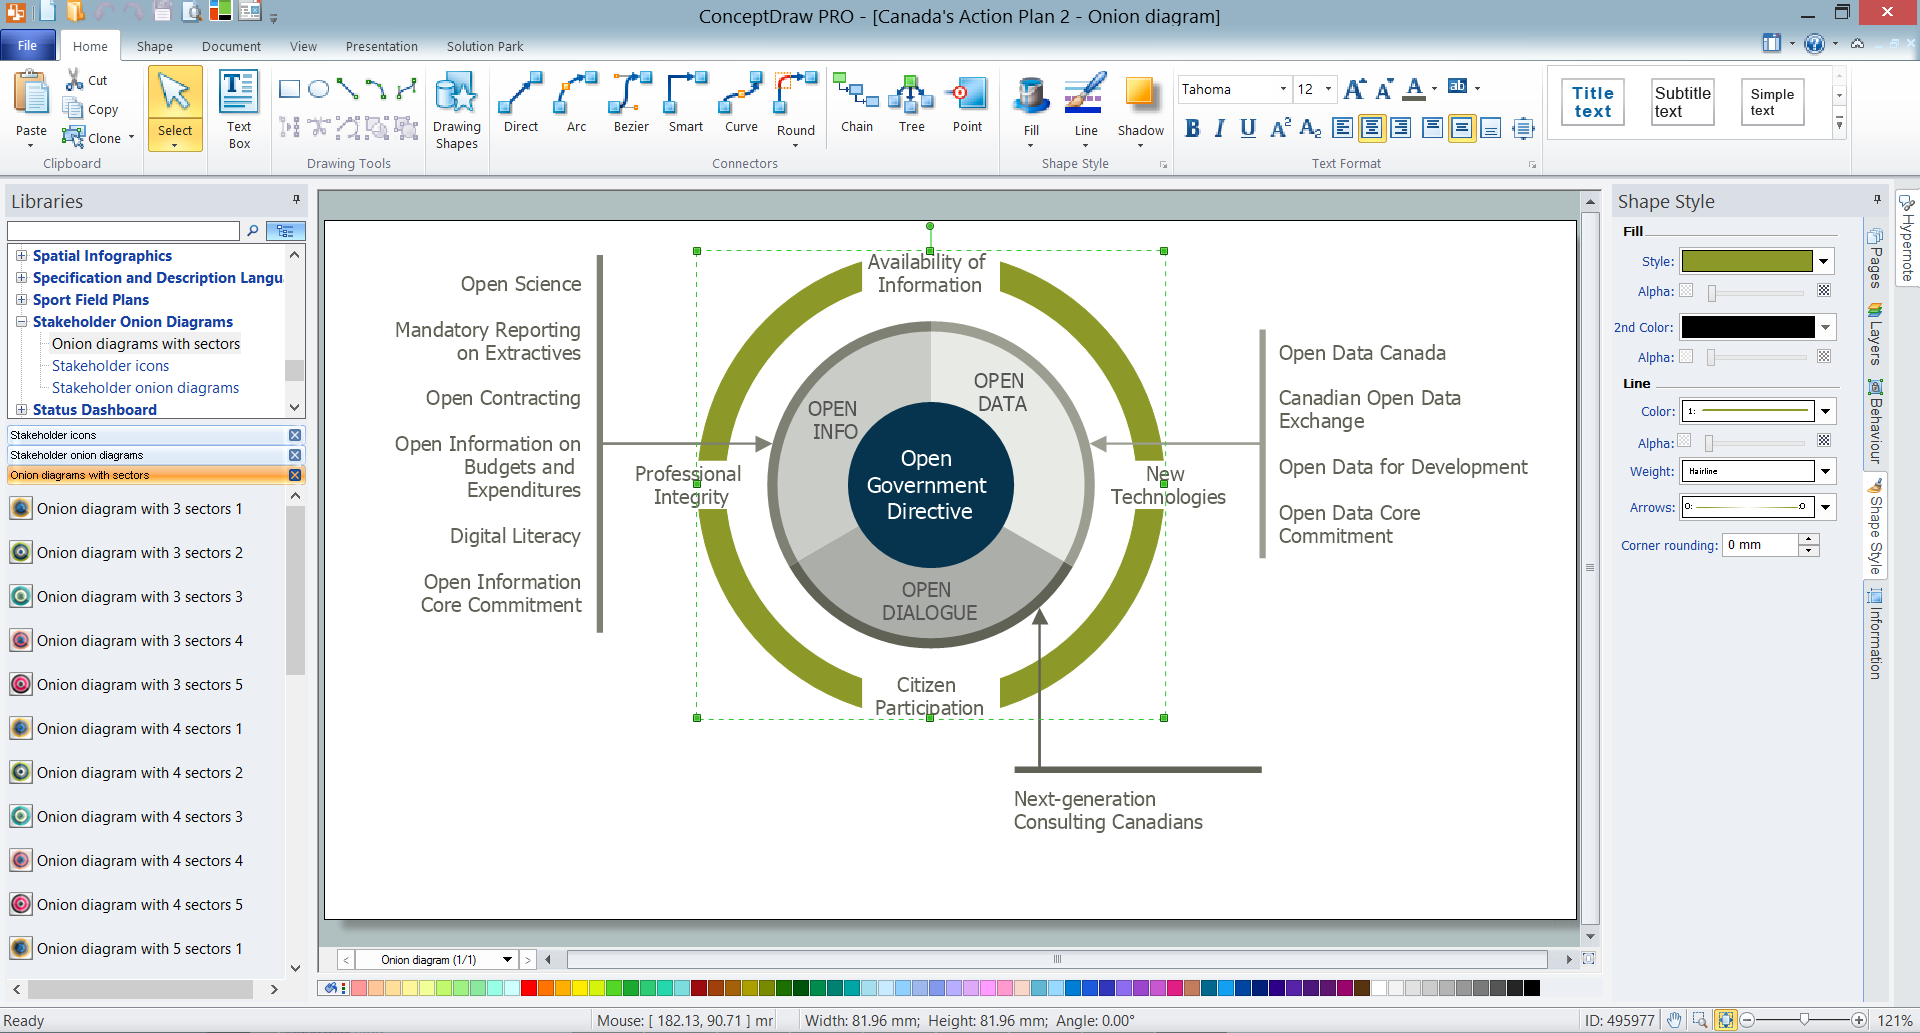
Picture: How To Create Onion Diagram
Related Solution:
No need for any special drawing skills to create professional looking diagrams outside of your knowledge base. ConceptDraw DIAGRAM takes care of the technical details, allowing you to focus on your job, not the drawing.
ConceptDraw DIAGRAM delivers full-functioned alternative to MS Visio. ConceptDraw DIAGRAM supports import of Visio files. ConceptDraw DIAGRAM supports flowcharting, swimlane, orgchart, project chart, mind map, decision tree, cause and effect, charts and graphs, and many other diagram types.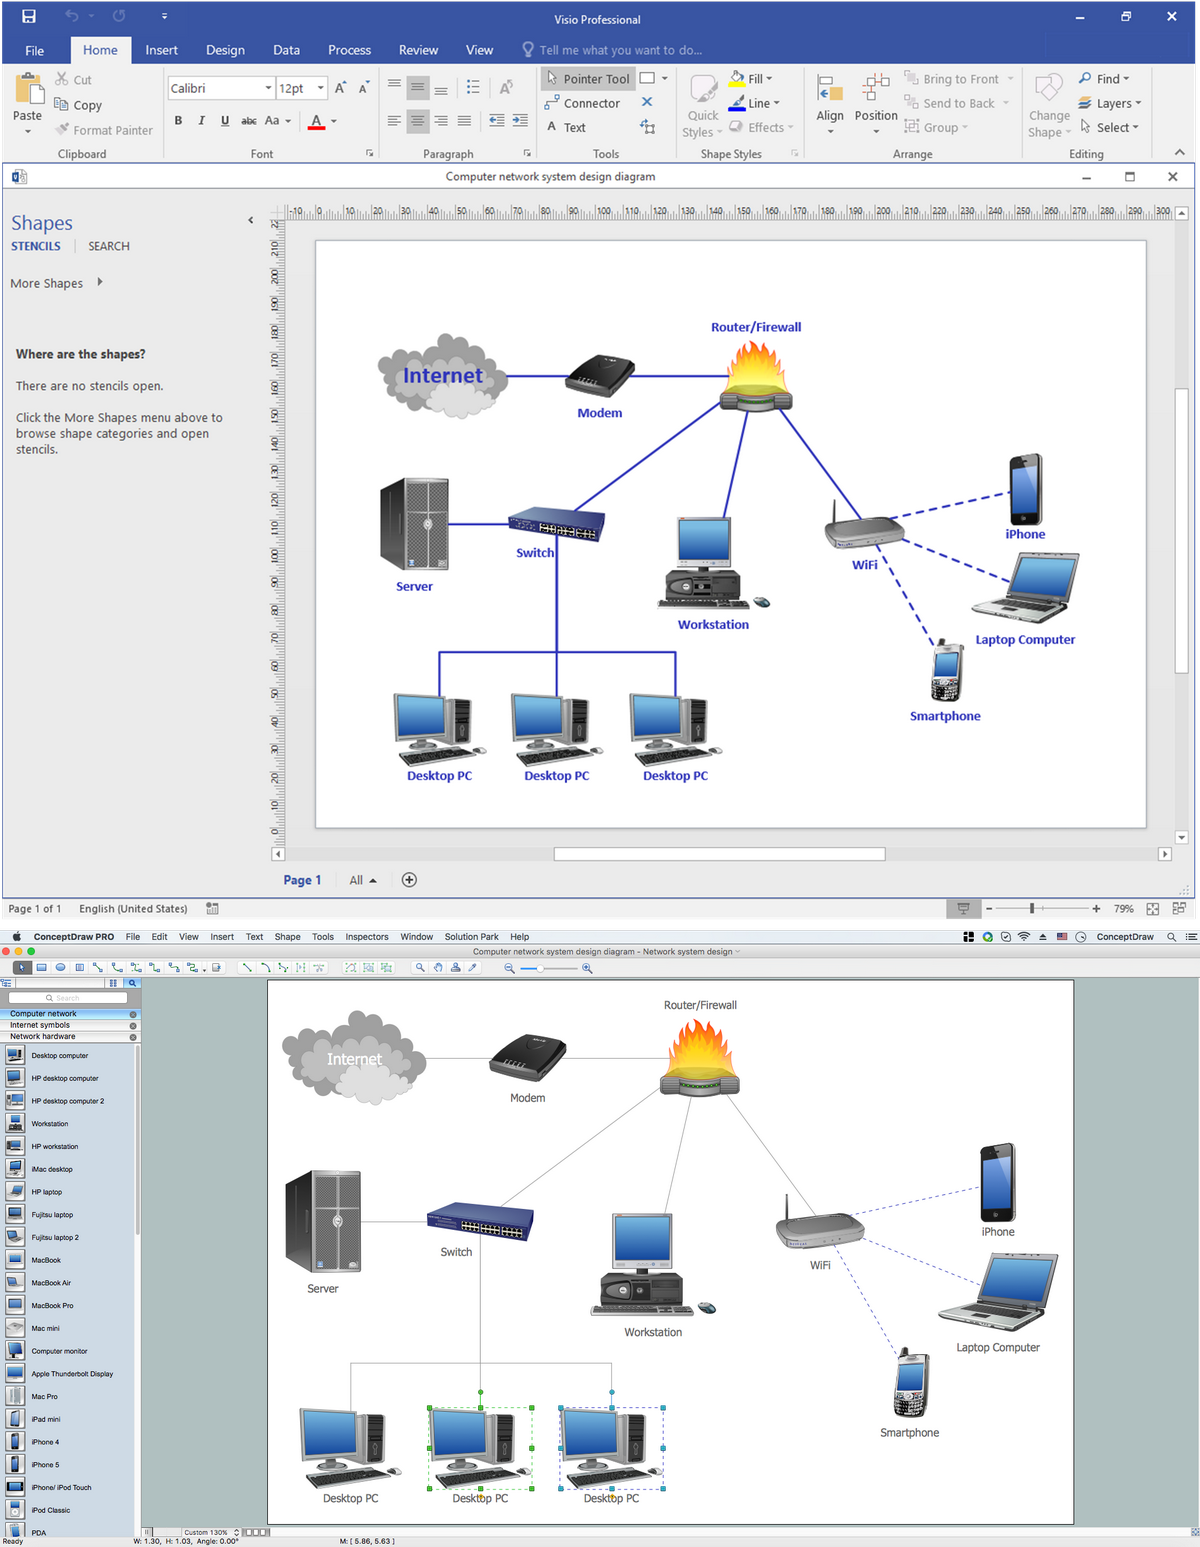
Picture: MS Visio Look a Like Diagrams
ConceptDraw DIAGRAM with the Workflow Diagrams solution delivers a complete set of samples and templates. This set contains basic workflow examples you may use to start drawing your own workflow or to get closer with workflow idea.
Picture: Basic Workflow Examples
Related Solution:
ConceptDraw
DIAGRAM 18