What is SWOT Analysis in Marketing
A SWOT analysis provides professionals to identify the positives and negatives in the organization and in the external environment. Developing a full awareness of your situation can help with both strategic planning and decision-making. The SWOT and TOWS method was developed for business and industry. It involves specifying the objective of the project and identifying the internal and external causes for the accomplishing project goals.
The ConceptDraw DIAGRAM and MINDMAP software allow professional to make well-designed SWOT matrix in minutes. The SWOT Analysis solution includes the SWOT matrix samples, and templates that allow users create own SWOT diagram.
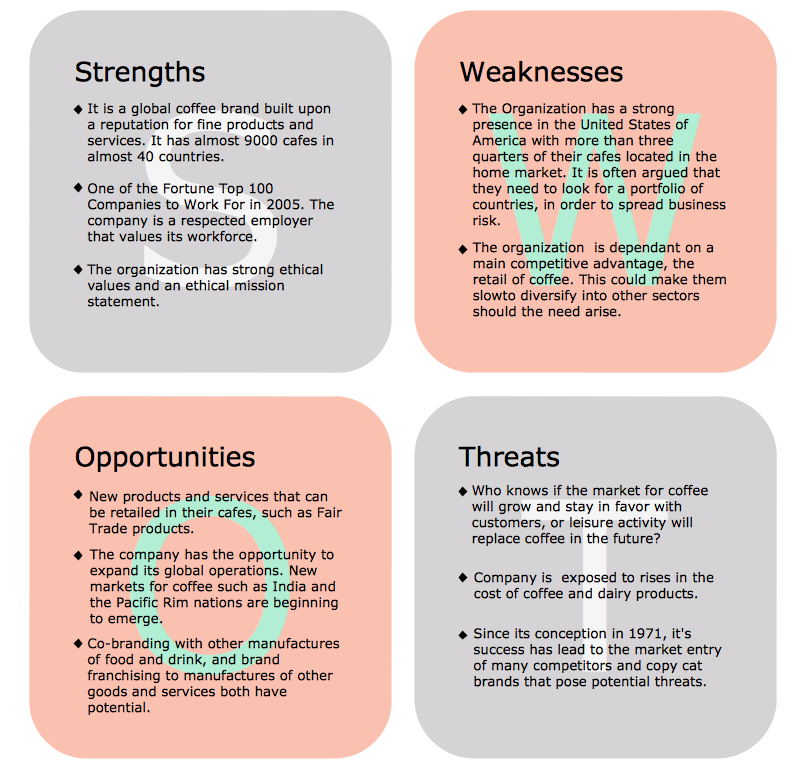
Sample 1. SWOT analysis in marketing - Coffee company.
This diagram illustrates usage of SWOT analysis in marketing.
Using ConceptDraw MINDMAP enhanced with SWOT Analysis solution you can create SWOT and TOWS mindmaps by simply filling in templates. Then you can generate SWOT and TOWS matrices in ConceptDraw DIAGRAM diagramming software from the mindmaps in ConceptDraw MINDMAP in one click.
See also:
Marketing — Matrices
- Marketing positioning matrix - Product positioning map
- Product-market matrix - Ansoff matrix
- BCG matrix - Boston growth-share matrix
- Feature comparison chart - Digital scouting cameras
- Marketing matrix diagram - Competitive strategies
- Marketing matrix diagram - Porters value chain
Marketing — Mind Maps
- Marketing mindmap - Marketing research project
- Marketing mind map - Strategic accomplishment mapping
- Twitter Compaign for New Software Product
- Marketing mind map - Sales Call
TEN RELATED HOW TO's:
SWOT matrix templates is part of SWOT Analysis solution from ConceptDraw Solution Park.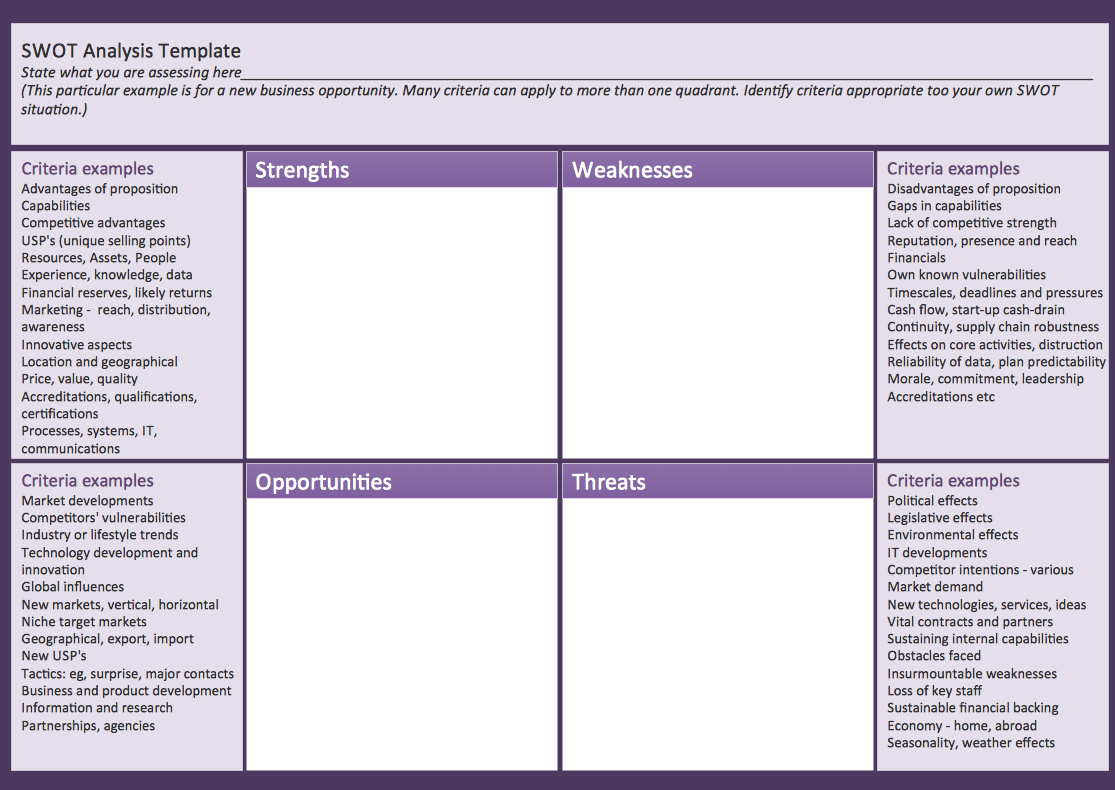
Picture: SWOT matrix template
It's obvious that any building has a plan, and it is a hard and diligent work to draw one. And it's great that nowadays there are software tools for those purposes. For instance, ConceptDraw Pro contains design elements depicting different parts of sport fields. It's easy to use them and it facilitates your work exponentially.
Planning of athletic facilities, playgrounds and Leisure Centers, needs thoughtful and creative approach. Any layout regarding to sport facilities should satisfy the requirements of both athletes and spectators. Well designed sport fields , playgrounds and recreation spaces attract people to sport activities in the cities and countryside. ConceptDraw Sport Field Plans solution is useful and convenient professional drawing tool. It delivers the kit of vector libraries that can be used for representing sport fields, sportgrounds and recreation spaces: football, hockey, volleyball, cricket, basketball , swimming pool, etc.
Picture: Building Drawing Software for Design Sport Fields
Related Solution:
A flowchart is a simple but very functional tool when it comes to understanding a workflow or to removing unnecessary stages from a process. When drawing flowcharts, keep in mind that there are four common types of flowcharts, like document flowcharts and data flowcharts that show control over a data or document flow over a system. To show controls on a physical level, use system flowcharts. In addition, to show controls in a program, you can draw a program flowchart.
This flowchart diagram represents the piece of an article editing process, that involves the author and editor. It was created using the Basic Flowchart notation that consists from the basic flowchart symbols. The start and the end of the process are indicated with "Terminator" symbols. The "Process" symbols show the action steps consisting from making edits and searching for a compromise, when the author does not agree with the suggestions of the editor. The "Process" symbol is the general symbol in process flowcharts. The "Decision" symbol indicates a branching in the process flow. There are two branches indicated by a Decision shape in the current flowchart (Yes/No, Disagree/Agree). This basic flowchart can be used as a repeating unit in the workflow diagram describing the working process of some editorial office.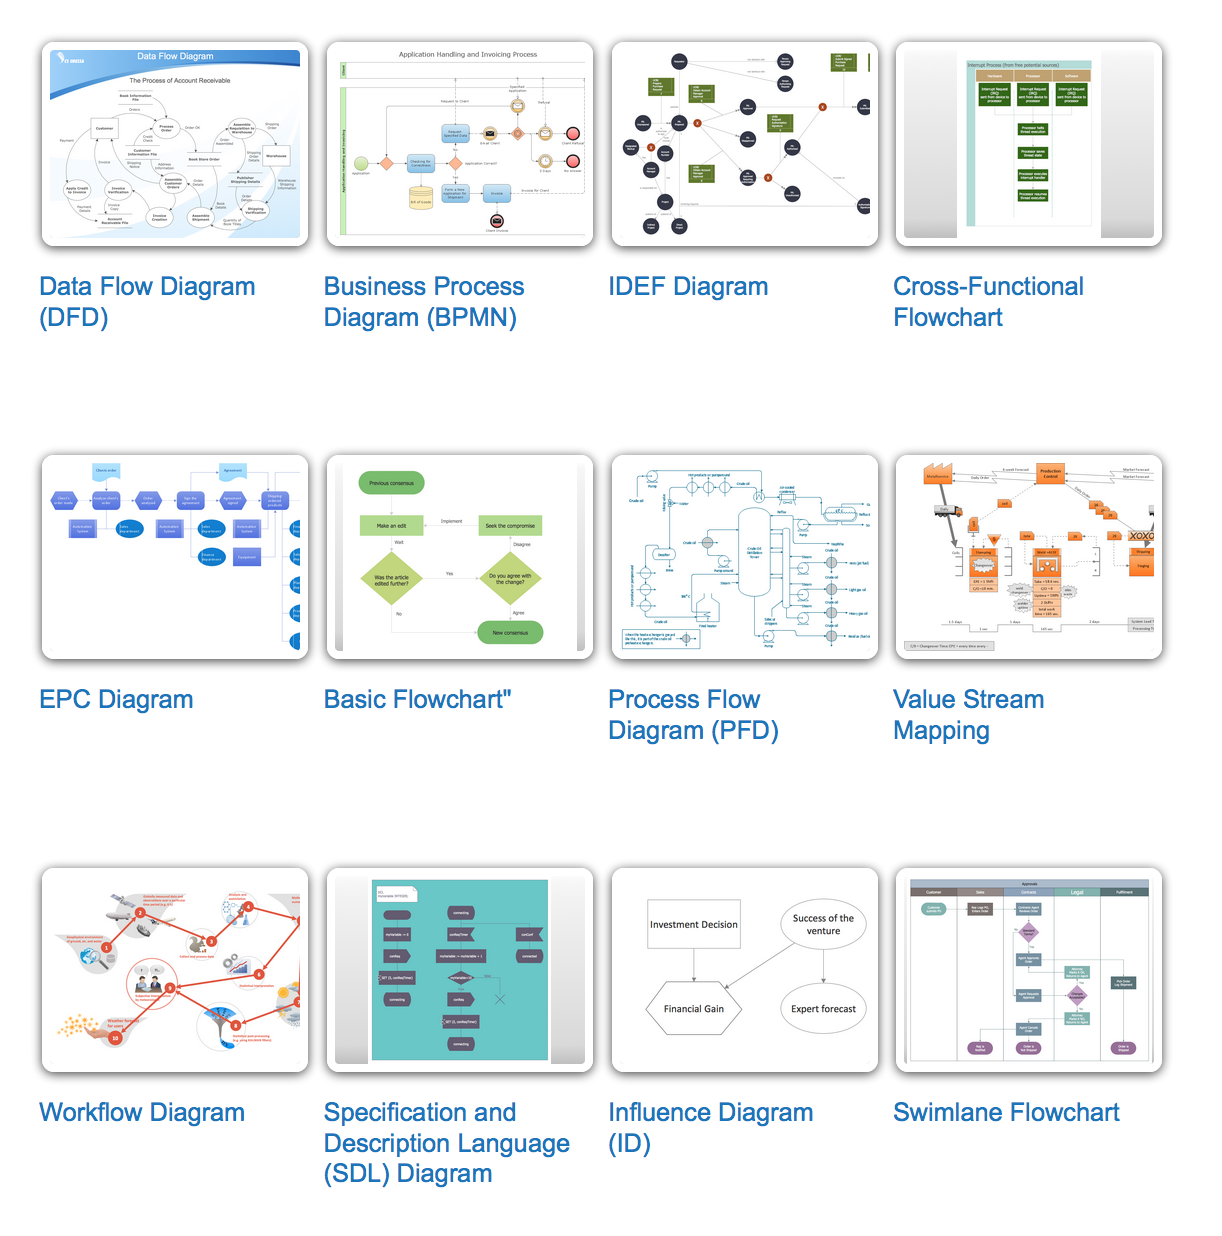
Picture: Types of Flowcharts
Related Solution:
ConceptDraw - Perfect Network Diagramming Software with abundant examples and templates. ConceptDraw Network Diagram is ideal for network engineers and network designers who need to draw Enterprise Private Network diagrams.
Picture: Network Diagram SoftwareEnterprise Private Network
Related Solution:
These vector illustrations and cliparts are created for drawing the Project management Illustrations and contain plenty of project management design elements. The clipart library Project management includes 35 icons.
Picture: Project management - Design Elements
Related Solution:
ConceptDraw DIAGRAM diagramming and vector drawing software extended with Specification and Description Language (SDL) Solution from the Industrial Engineering Area of ConceptDraw Solution Park provides powerful drawing tools for quick and easy creating well-designed FSM diagrams.
Picture: FSM — Finite-state Machine
Related Solution:
Use the Basic Diagramming Solution from the Universal Diagramming area of ConceptDraw Solution Park to easy create simple forms, questionnaires, survey forms, registration and application forms, etc.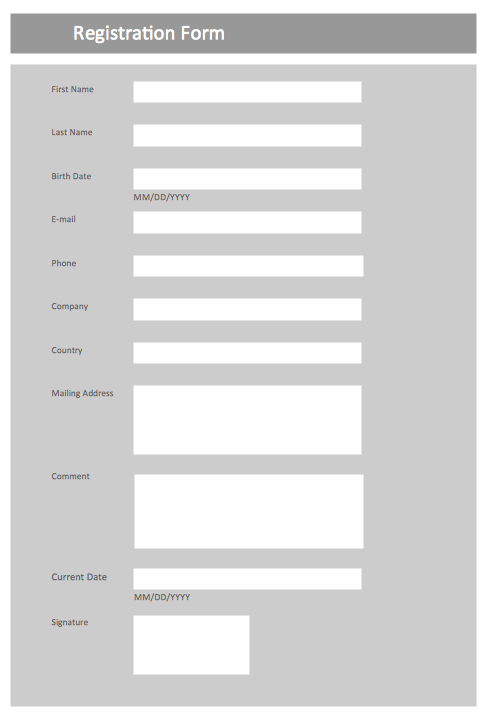
Picture: Form Maker
Related Solution:
To build Strategies - powerful feature of ConceptDraw MINDMAP allows to combine the power of MINDMAP with the accessibility of the world’s favorite human memory platform, Evernote.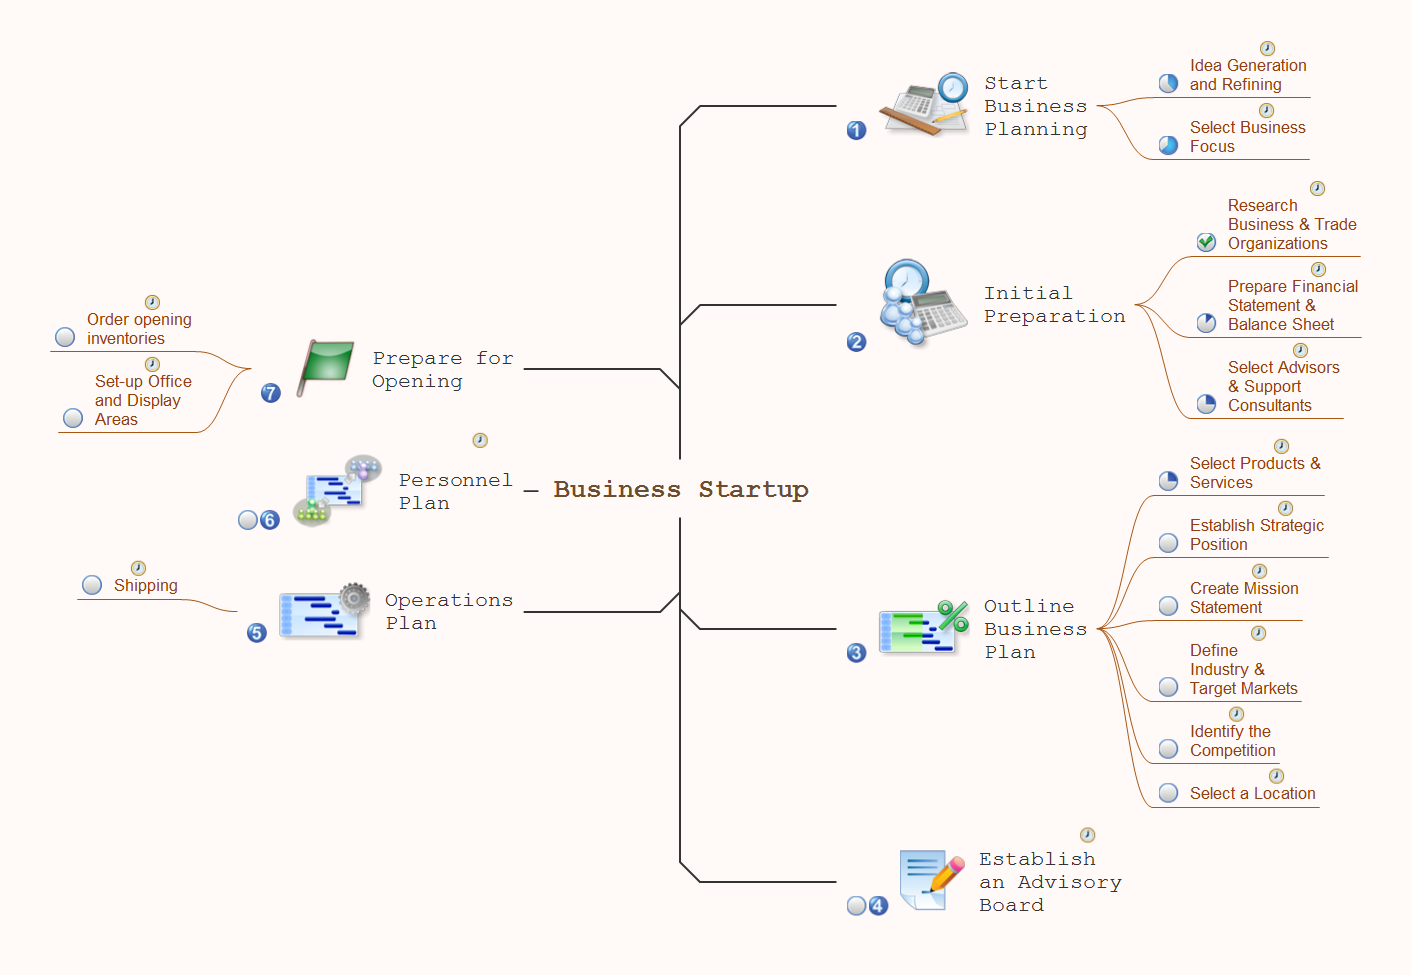
Picture: Build Strategies Exchanging Mind Maps with Evernote
Related Solution:
A detailed mind map about the various elements and stages of project management.
Picture: Project Management
Related Solution:
In software engineering, it is important to understand how the system would cooperate with external sources, like data sources. To give this information a visual representation, data flow diagrams (DFD) were used for years. The entire system is usually divided into smaller ones, and all of them process data flows in appropriate ways.
The visualizing business processes which engages the data transfer, is commonly preformed using DFDs (data flow diagrams). DFD is used to show the data flow processing and transformation. This DFD represents the electronic system of a customer purchase. It was created using Gane/Sarson notation. Data flow diagrams helps you to sort through and clarify transferring process making it available for analysis, and representation. ConceptDraw DFD solution introduces the vector library, containing the full set of icons from DFD notations.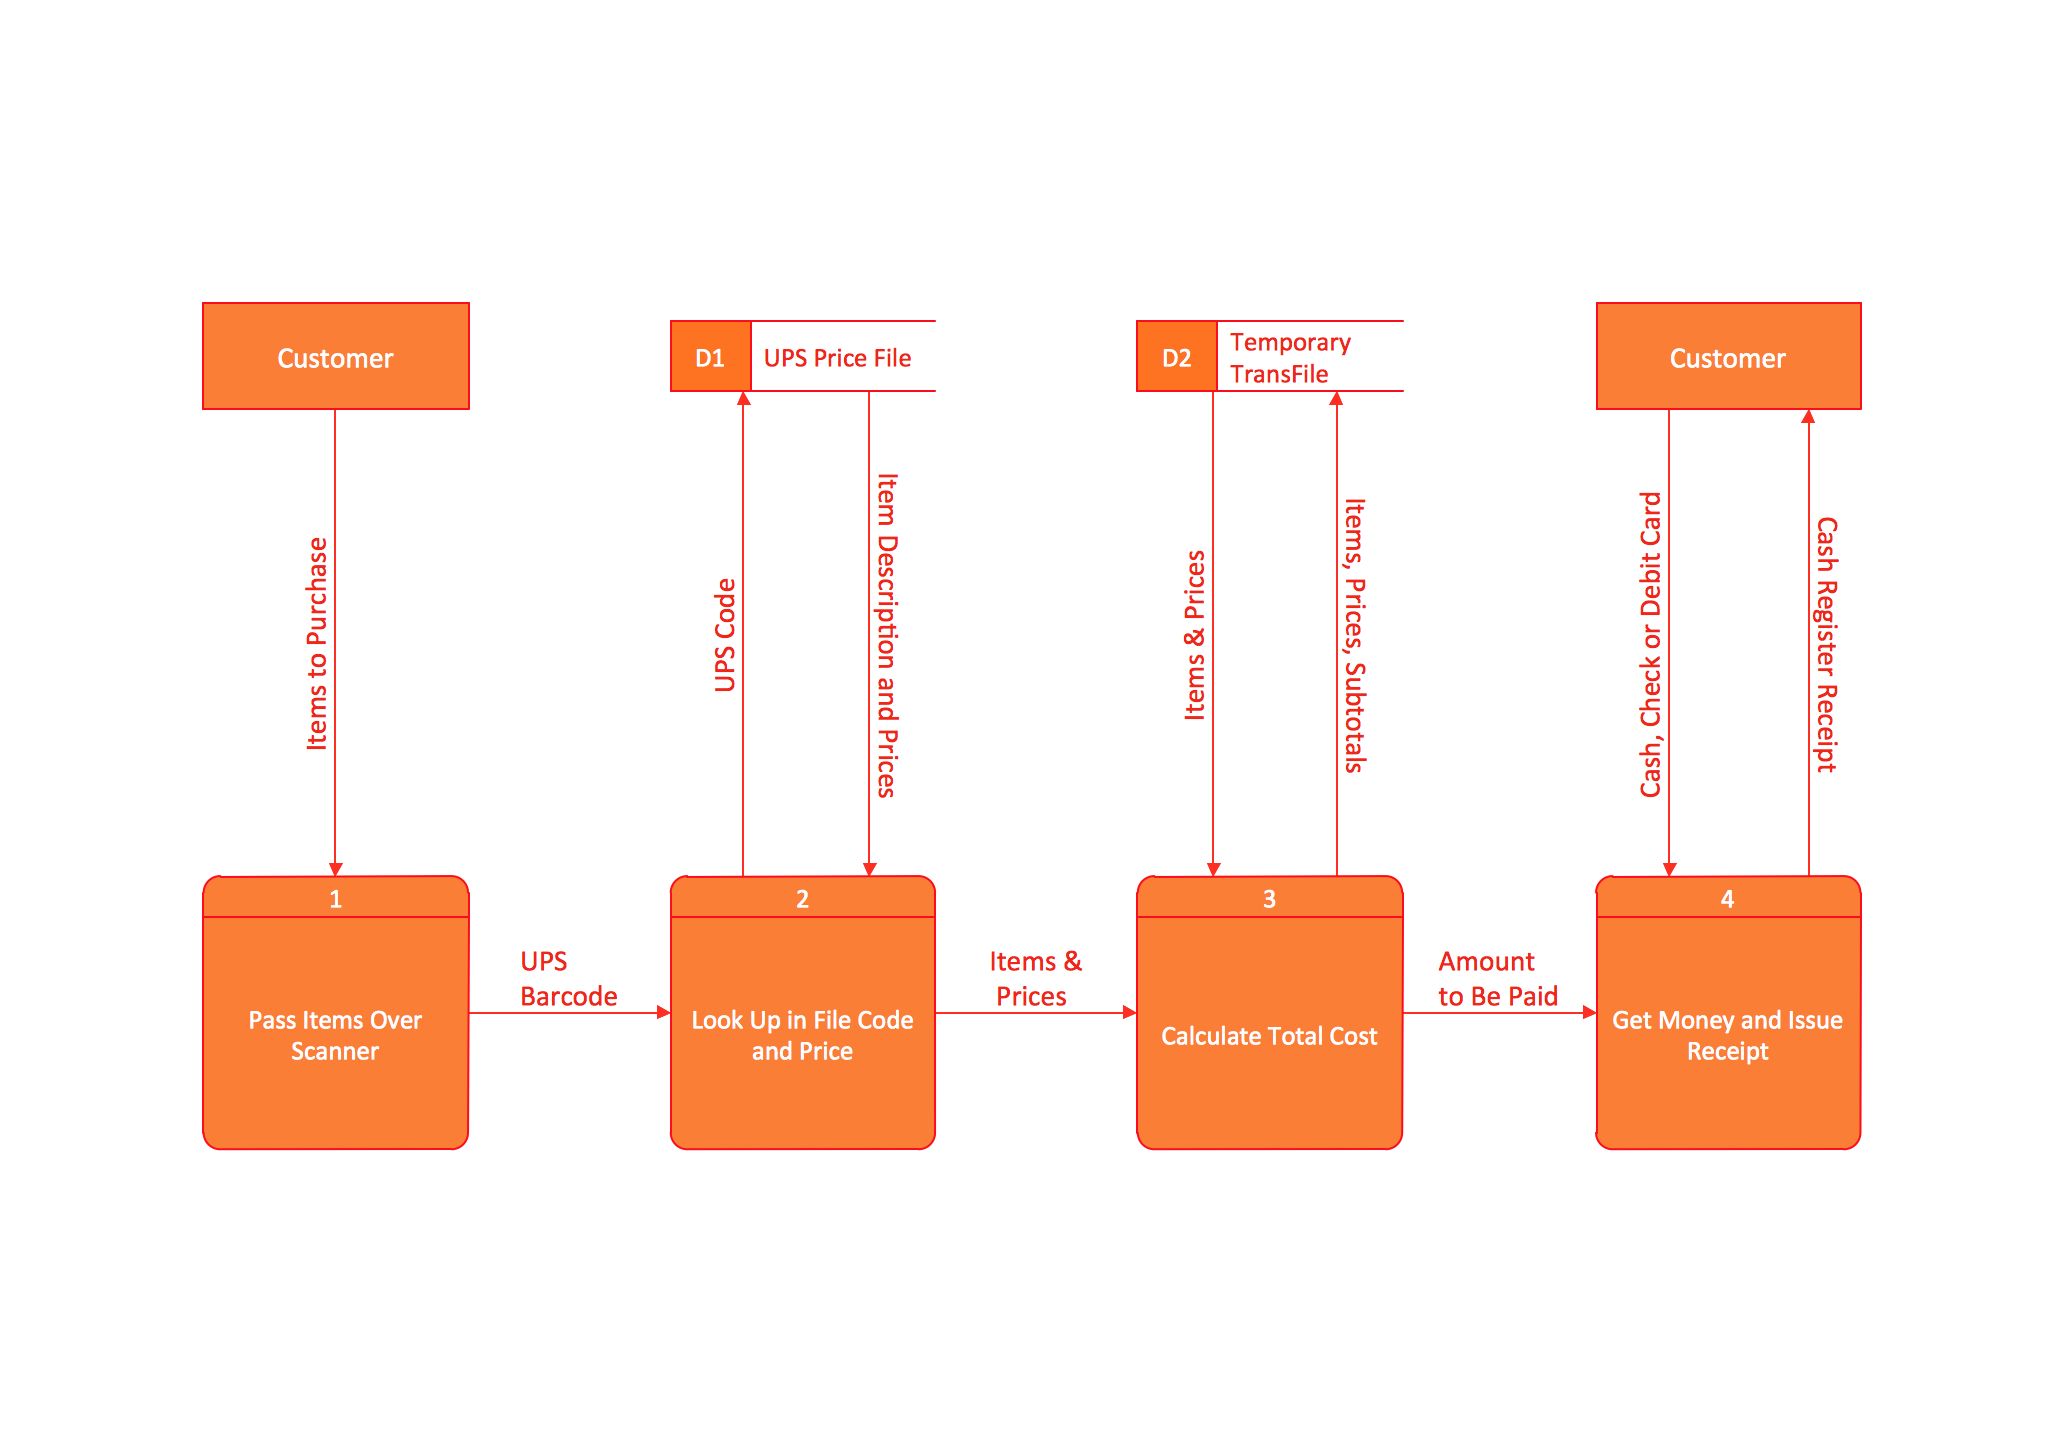
Picture: Data Flow Diagram (DFD)
Related Solution: