When To Use a Fishbone Diagram
Fishbone diagrams work for most entrepreneurs and almost any industry or person having a problem. It also named as Cause and Effect diagram or Ishikawa diagram or Cause and Effect fishbone diagram. To create it with automated diagram software use ConceptDraw DIAGRAM software. It helps illustrate and visualize an issue and it's structure, ConceptDraw DIAGRAM will be your lifesaver.
When to use a Fishbone diagram? Originally developed as a quality control tool, you may find a Fishbone diagram helpful when used in next cases:
- improving problem solving in common and keep focus on
- to analyze a complex problem with many causes;
- when you need different point of view to look on a problem;
- to identify possible root causes for an effect or a problem;
- to uncover bottlenecks and identify issue where and why a process doesn't work;
- to accelerate thinking process when traditional ways of problem solving are time consuming,
- great mind motivator to attack complex problem and uncover creative approach,
- an typical examples are: how solve manufacturing problems,
- applying it on Seven Basic Tools of Quality methodology
How to Construct a Fishbone Diagram
Constructing a diagram started with templates and use design elements to visually support the process of Cause and Effect Analysis. The problem visualized as the fish's head and the causes as fishbones. Head is facing to the right and the causes extending to the left. The ribs branch off the backbone for major causes, with sub-branches for root-causes, to as many levels as required. Lets look an examples...

Example 1. When To Use a Fishbone Diagram
When you need create a Fishbone diagram as quickly as possible, you can use one of ConceptDraw templates. Fishbone templates are offered in large quantity by Fishbone Diagrams solution at ConceptDraw STORE, moreover for both ConceptDraw DIAGRAM and ConceptDraw MindMap applications.
You can draw a Cause and Effect diagram fully at ConceptDraw DIAGRAM If you prefer to use brainstorming technique when creating, you can use the ConceptDraw MindMap application and then output your mind map as Fishbone diagram to ConceptDraw DIAGRAM document.

Example 2. Well Constructed Fishbone Diagram - HAN Project
Fishbone Diagrams Solution provides also variety of samples and examples of Fishbone diagrams, and Fishbone Diagrams library with predesigned vector objects for self-drawing.
You can also benefit from the ConceptDraw DIAGRAM wide export capabilities, just a few seconds you can export your Ishikawa diagram to PDF, PPT, HTML, Visio, or any from variety of graphic formats.

Example 3. Export Fishbone Diagram to PDF, PPT, HTML and Visio
The samples you see on this page were created in ConceptDraw DIAGRAM using the predesigned objects from the Fishbone Diagrams library. They show some cases when to use a Fishbone Diagram is effective and reasonable. An experienced user spent 10 minutes creating each of these samples.
Use the tools of Fishbone Diagrams Solution for ConceptDraw DIAGRAM Solution Park to draw quick, easy and effective your own Ishikawa diagrams for problem solving.
All source documents are vector graphic documents. They are available for reviewing, modifying, or converting to a variety of formats (PDF file, MS PowerPoint, MS Visio, and many other graphic formats) from the ConceptDraw STORE. The Fishbone Diagrams Solution is available for all ConceptDraw DIAGRAM or later users.
TEN RELATED HOW TO's:
ConceptDraw DIAGRAM diagramming and vector drawing software extended with Fishbone Diagrams solution is a perfect tool for software designers and software developers. If you need to create Cause and Effect diagram, Fishbone diagram, Ishikawa diagram from templates and examples, or using the predesigned elements, ConceptDraw DIAGRAM can do this easily.
ConceptDraw DIAGRAM software gives ability to design Fishbone diagrams that identify many possible causes for an effect for problem. Each Fishbone diagram design element included to Fishbone Diagrams library is vector and ready-to-use..png)
Picture: Fishbone Diagram Design Element
Related Solution:
How do Fishbone diagrams solve manufacturing problems? Fishbone diagrams are successfully used in various fields of industries and manufacturing to analyze the set of possible causes and their effects. Fishbone diagram provides a process to clearly define the “Effect” and then puts you to thinking about the possible causes, based on the categories of common problems in manufacturing.
ConceptDraw DIAGRAM application extended with Fishbone Diagrams solution lets you construct Fishbone diagrams and represent globally recognized standards for manufacturing 6 Ms and 8 Ms.
Picture: How Do Fishbone Diagrams Solve Manufacturing Problems
Related Solution:
Fishbone diagram is a powerful tool used for solving business problems and obstacles. ConceptDraw DIAGRAM software extended with Fishbone Diagrams solution from the Management area of ConceptDraw Solution Park is a helpful tool for cause and effect analysis. It gives the ability to easy identify many possible causes and factors which cause the effects and to draw Fishbone Diagrams for problem solving.
Picture: Cause and Effect Analysis - Fishbone Diagrams for Problem Solving
Related Solution:
Fishbone diagram, often reffered as Cause and Effect diagram or Ishikawa diagram, is one of the basic and the most effective tools for problems solving. It is a way of graphical identifying, structuring and exploration the root causes of a problem for determining effective decision.
ConceptDraw DIAGRAM enhanced with Fishbone Diagrams solution is a professional fishbone problem solving tool which helps you draw Business Productivity diagram, Cause and Effect, Fishbone, Ishikawa Diagrams to solve problems at your business.
Picture: Fishbone Problem Solving Tool
Related Solution:
Collaborating with co-workers is very important, not only in order to get things done effectively, but also to keep in touch with the outside world. Great way for business collaboration is Skype.
Picture: Online Collaboration via Skype
Related Solution:
Electrical plan is a document that is developed during the first stage of the building design. This scheme is composed of conventional images or symbols of components that operate by means of electric energy. To simplify the creation of these schemes you can use house electrical plan software, which will not require a long additional training to understand how to use it. You only need to install the necessary software ant it’s libraries and you’ll have one less problem during the building projection.
Any building contains a number of electrical systems, including switches, fixtures, outlets and other lightening equipment. All these should be depicted in a building electrical plans and included to general building documentation. This home electrical plan displays electrical and telecommunication devices placed to a home floor plan. On the plan, each electrical device is referenced with the proper symbol. Electrical symbols are used for universal recognition of the building plan by different persons who will be working on the construction. Not all possible electric symbols used on a certain plan, so the symbols used in the current home plan are included to a legend. The electrical home plan may be added as a separate document to a complete set of building plans.
Picture: How To use House Electrical Plan Software
Related Solution:
Identify the root causes of quality issues with Fishbone diagram. Because Fishbone diagram is hierarchical it is well-suited for capturing in a mind map for reviewing process towards proving which branch is the real root cause of an issue.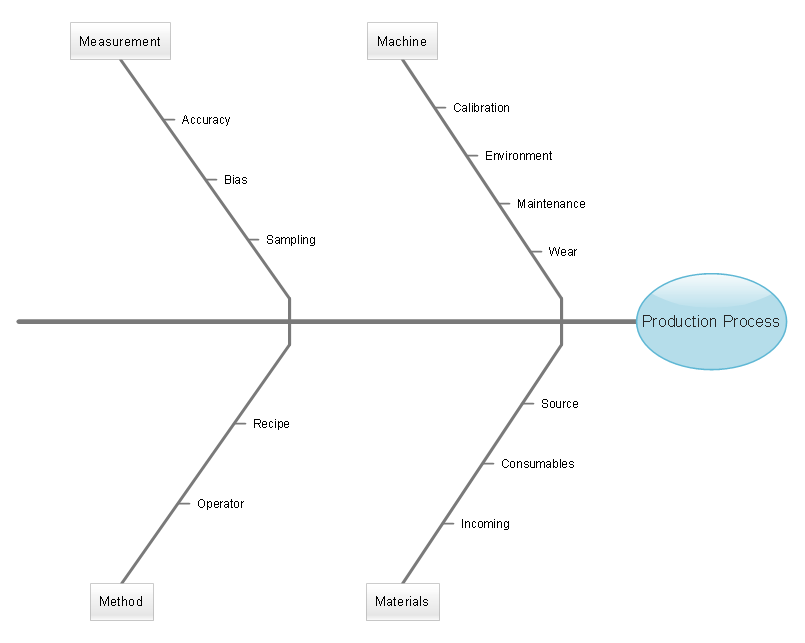
Picture: Fishbone Diagram
Related Solution:
Communication is the main challenge and the key success factor for remote project management. Communicating visually via Skype you bring all team and customers onto the one page.
Remote Presentation for Skype solution for ConceptDraw MINDMAP helps communicate with remote team and customers in visual manner on wide range of issues. Using this solution for regular status meetings allows you to push your team on tasks and keep task statuses up to date.
Picture: Communication Tool for Remote Project Management
Related Solution:

