Why is it important to have a
formal purchasing process?
Flowchart
It is important to know how purchasing processes work and how each operation is done. The Accounting Flowcharts Solution allows to document and present visually purchasing processes. ConceptDraw DIAGRAM is a software for drawing flowcharts and it gives the ability to draw flowcharts that accurately represent purchasing processes in the organization.

Sample 1. Purchasing process flowchart.
Accounting Flowcharts solution from ConceptDraw Solution Park provides templates, samples and library of vector shapes for drawing the accounting process flow charts.
Use ConceptDraw DIAGRAM with Accounting Flowcharts solution to document and communicate visually how accounting processes work, and how each operation is done.
TEN RELATED HOW TO's:
ConceptDraw DIAGRAM extended with Cross-Functional Flowcharts Solution from the Business Processes Area is a powerful software which offers a variety of Cross Functional Flowchart examples. The use of predesigned examples as the base for your own Cross Functional Flowchart Diagrams is a timesaving and useful way.
Picture: Cross Functional Flowchart Examples
Related Solution:
ConceptDraw DIAGRAM diagramming and vector drawing software extended with Seating Plans solution from the Building Plans area of ConceptDraw Solution Park is the best for quick and easy drawing the seating arrangement plans.
Picture: Seating Arrangement
Related Solution:
While creating flowcharts and process flow diagrams, you should use special objects to define different statements, so anyone aware of flowcharts can get your scheme right. There is a short and an extended list of basic flowchart symbols and their meaning. Basic flowchart symbols include terminator objects, rectangles for describing steps of a process, diamonds representing appearing conditions and questions and parallelograms to show incoming data.
This diagram gives a general review of the standard symbols that are used when creating flowcharts and process flow diagrams. The practice of using a set of standard flowchart symbols was admitted in order to make flowcharts and other process flow diagrams created by any person properly understandable by other people. The flowchart symbols depict different kinds of actions and phases in a process. The sequence of the actions, and the relationships between them are shown by special lines and arrows. There are a large number of flowchart symbols. Which of them can be used in the particular diagram depends on its type. For instance, some symbols used in data flow diagrams usually are not used in the process flowcharts. Business process system use exactly these flowchart symbols.
Picture: Flowchart Symbols: Meaning and Examples
Related Solution:
Starting producing workflow diagram from template you save time and avoid the blank page syndrome. At first, the workflow template is set of rules for a workflow. The workflow symbols used in the specific case are part of workflow template. This is the subset of large standard collections of workflow symbols. The first part of workflow template is identification of symbols allowed in use in your specific case. The best way would be to collect them in your customized drawing collection of workflow symbols which used in your specific cases of workflow diagrams. Another way to create business process documents is using business process flow diagram which have similar purposes and have different visual notation.
ConceptDraw DIAGRAM is professional workflow diagram software with the rich extentions from ConceptDraw Solution Park. The basic solution for workflow diagramming is Workflow Diagrams Solution. It delivers a rich set of workflow diagram templates and samples help you draw diagrams e
Picture: Workflow Diagram Template
Related Solution:
When thinking about data visualization, one of the first tools that comes to mind is a flowchart design. You can find flowchart symbols, shapes, stencils and icons easily on the Internet, but it might take time to systematize this information. Nevertheless, once you start flowcharting, you’ll love its simplicity and efficiency.
This diagram consists from standard flowchart symbols, approved by ANSI (American National Standard Institute) for drawing flowcharts. A flowchart is a diagram that represents a step-by-step algorithm of any process, displaying the process stages as boxes that are connected with arrows. Flowchart design makes it clear and readable.
Flowchart designed using ConceptDraw DIAGRAM flowchart software allows to make attractive and clear process presentation, it makes interpretation of the business process flow fresh and versatile. Great flowchart design view is a big advantage over the diagram created manually on a paper.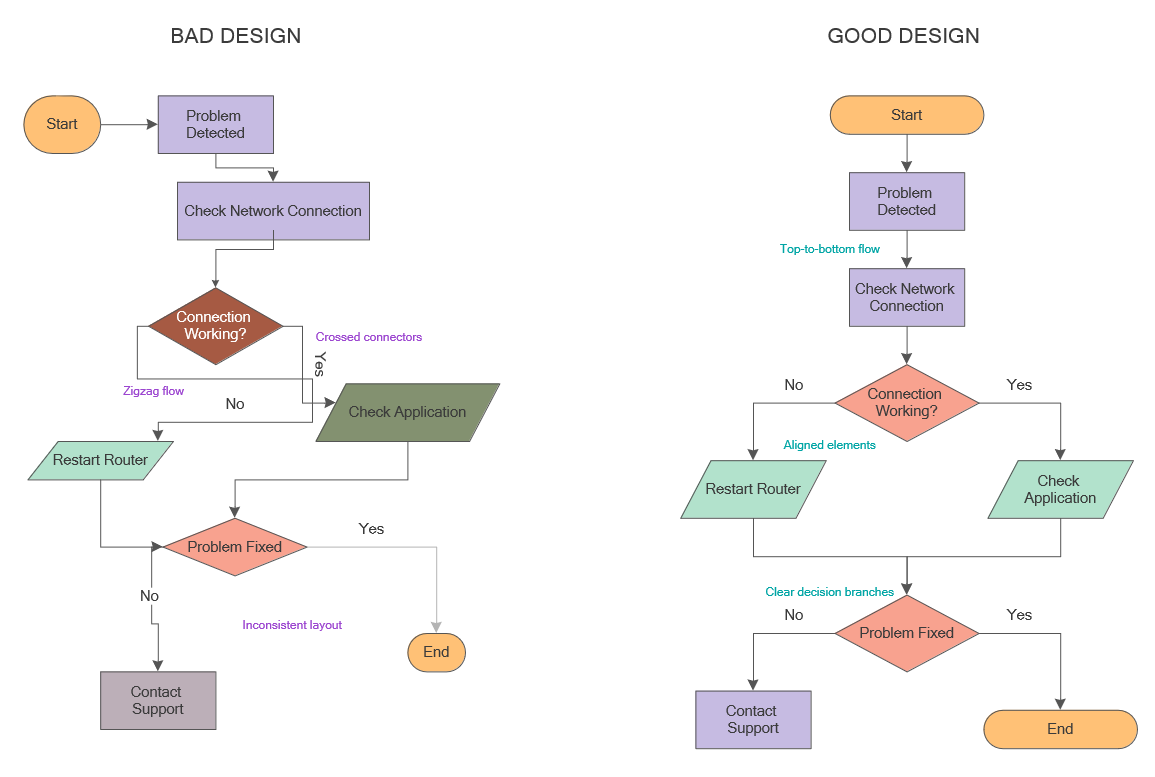
Picture: Flowchart Design: Principles, Layout, Symbols and Best Practices
Related Solution:
This pyramid chart example is supplied with the ConceptDraw Pyramid Diagrams solution. This is a model of Information Management Systems classification. It is made in a form of a four-level pyramid. The top level shows the information system developed for an executive management. Below, there is a level depicting the system of decision making process for the managers of the senior level. A schematic representation of the middle management information system, following to logic, is in the middle of the pyramid. And at least, the lowermost level represents an information processing system for employees.
Picture: Pyramid Diagram
Related Solutions:
ConceptDraw DIAGRAM diagramming and vector drawing software extended with Flowcharts Solution from the 'Diagrams' area of ConceptDraw Solution Park is a powerful tool for drawing Flow Charts of any complexity you need. Irrespective of whether you want to draw a Simple Flow Chart or large complex Flow Diagram, you estimate to do it without efforts thanks to the extensive drawing tools of Flowcharts solution, there are professional flowchart symbols and basic flowchart symbols. This sample shows the Gravitational Search Algorithm (GSA) that is the optimization algorithm.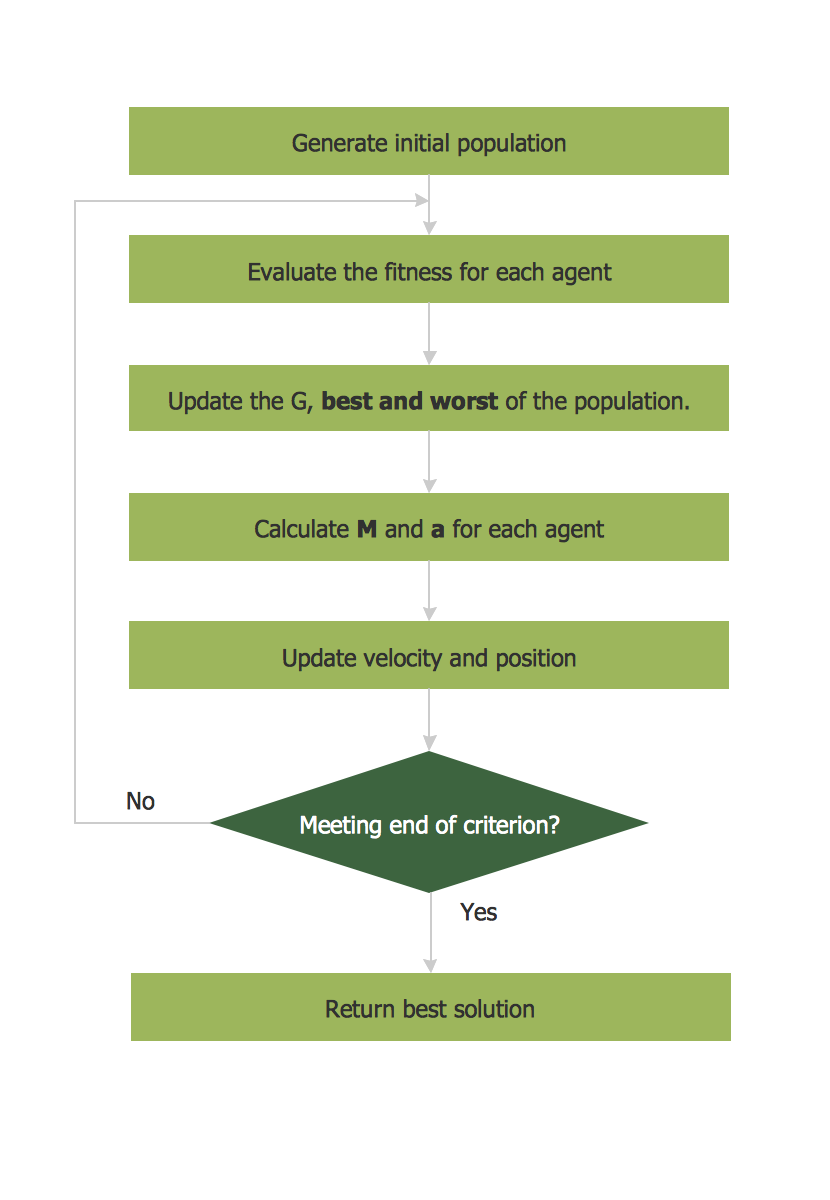
Picture: Simple Flow Chart
Related Solution:
ConceptDraw DIAGRAM charting and vector drawing software offers the Circle Spoke Diagram Template included to the Business Diagrams Solution from the Management Area. The use of ready template is the easiest way of drawing professional-looking Circle-Spoke Diagrams.
Picture: Circle Spoke Diagram Template
Related Solution:
This sample was created in ConceptDraw DIAGRAM diagramming and vector drawing software using the UML Class Diagram library of the Rapid UML Solution from the Software Development area of ConceptDraw Solution Park.
This sample describes the use of the classes, the generalization associations between them, the multiplicity of associations and constraints. Provided UML diagram is one of the examples set that are part of Rapid UML solution.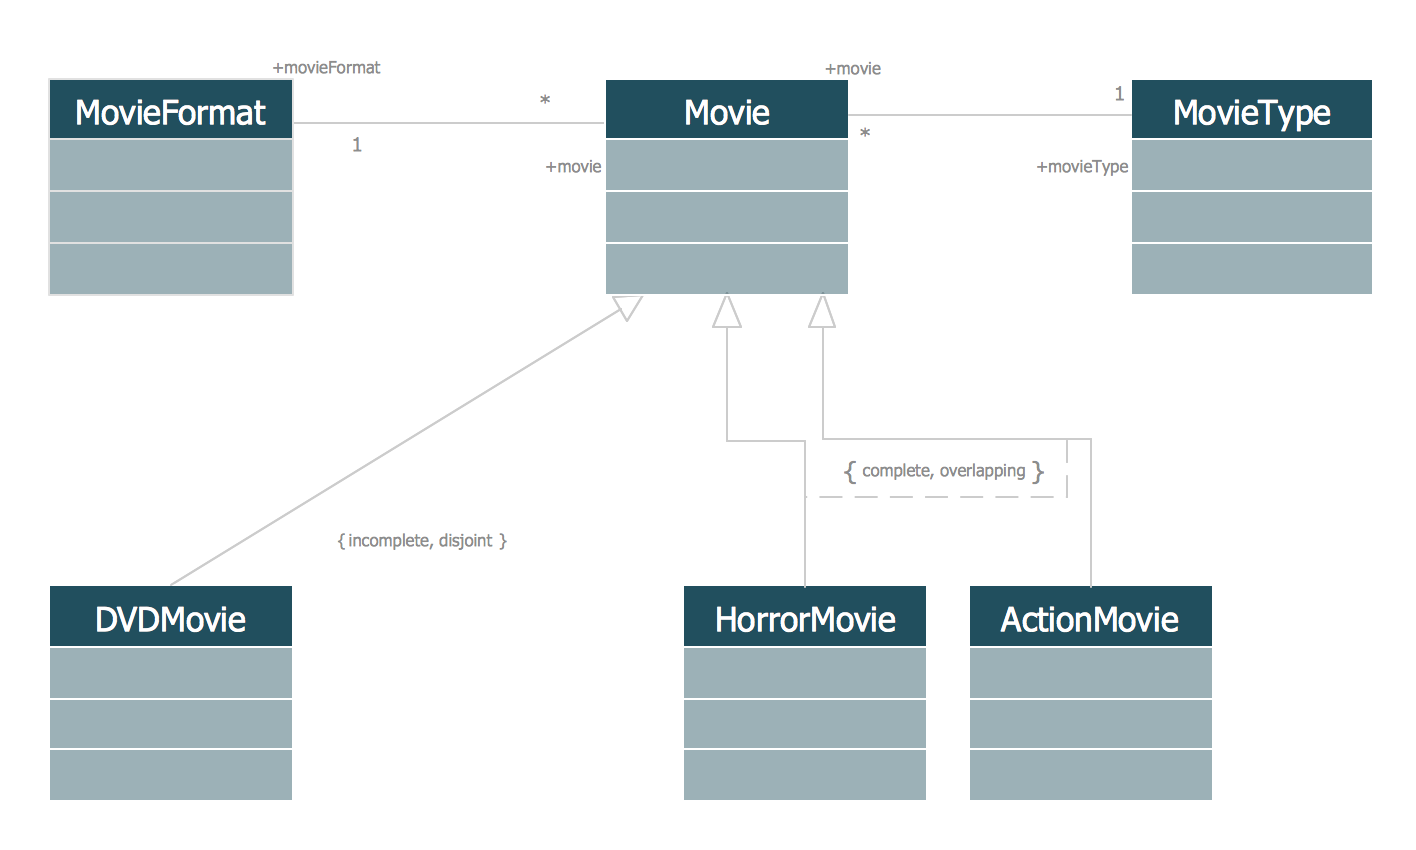
Picture: UML Class Diagram Generalization ExampleUML Diagrams
Related Solution:
The Value stream is a totality of all actions on the projection, order composition and production: starting from creation a product project to launching this product, from order to delivery, from extraction of raw materials to ready product manufacturing. Value stream mapping is a process of visualization of these actions and creation of a detailed and graphical map.
Picture: Value stream with ConceptDraw DIAGRAM
Related Solution:
ConceptDraw
DIAGRAM 18