Winter Sports.
Using Winter Sports Design Elements Producing Infographics
Winter Sports Infographics
ConceptDraw DIAGRAM is a software for making infographics. Extended with the Winter Sports solution it allows users produce illustrated sport infographics using design elements contained in solution's libraries.
The library objects are scalable vector images that can be easily exported to PDF format, Microsoft PowerPoint, Microsoft Visio, graphic image file, or HTML.
The Winter sport pictogram library available in the Winter Sports solution contains
- alpine skiing,
- biathlon,
- bobsleigh,
- cross-country,
- curling,
- figure skating,
- freestyle skiing,
- ice hockey,
- luge,
- nordic combined,
- short track,
- skeleton,
- ski jumping,
- snowboard,
- speed skating,
and other sports symbols you may need to illustrate ny kind of sport infographics.

Sample 1. Winter Sports - Design elements
The Winter Sports solution from Sport Area of ConceptDraw Solution Park contains winter sports illustrations and diagram examples, templates, and vector sport pictogram libraries.
The Winter Sports helps you to quickly create your own original winter sports illustrations and infographics, presentation slides, website, and blog pages using ConceptDraw DIAGRAM diagramming and vector drawing software.
NINE RELATED HOW TO's:
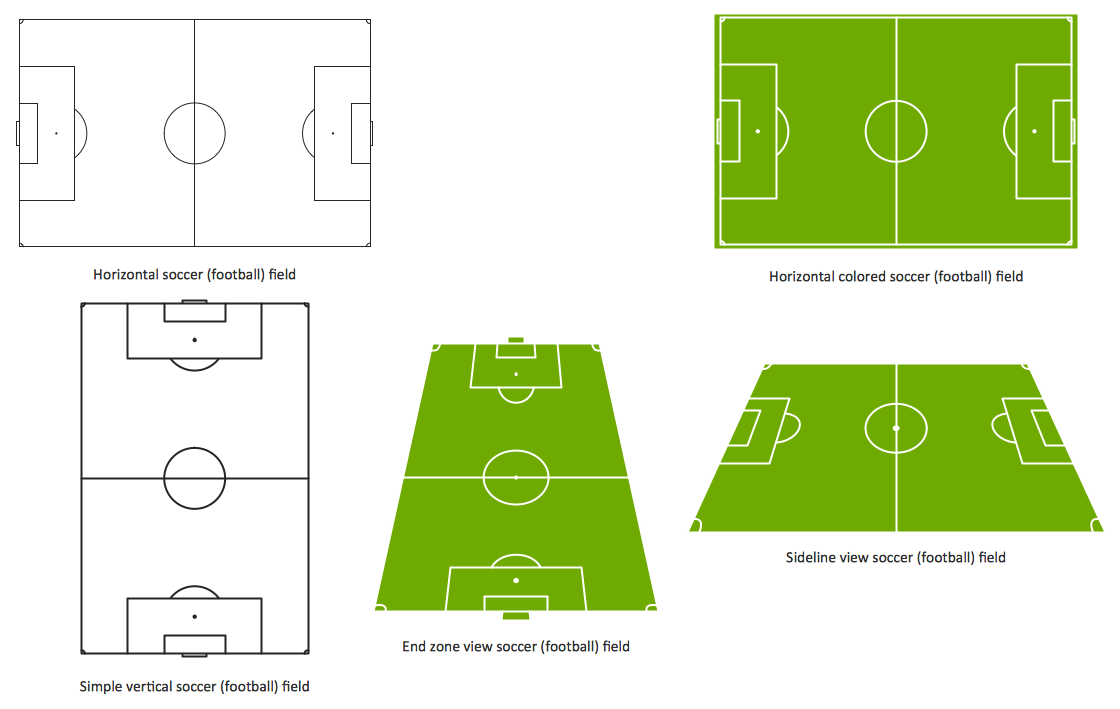
The Soccer (Football) Fields library from the Soccer solution from the Sport area of ConceptDraw Solution Park provides a complete set of predesigned fields: horizontal and vertical located, colored or not, end zone view soccer field.
Picture: Design a Soccer (Football) Field
Related Solution:
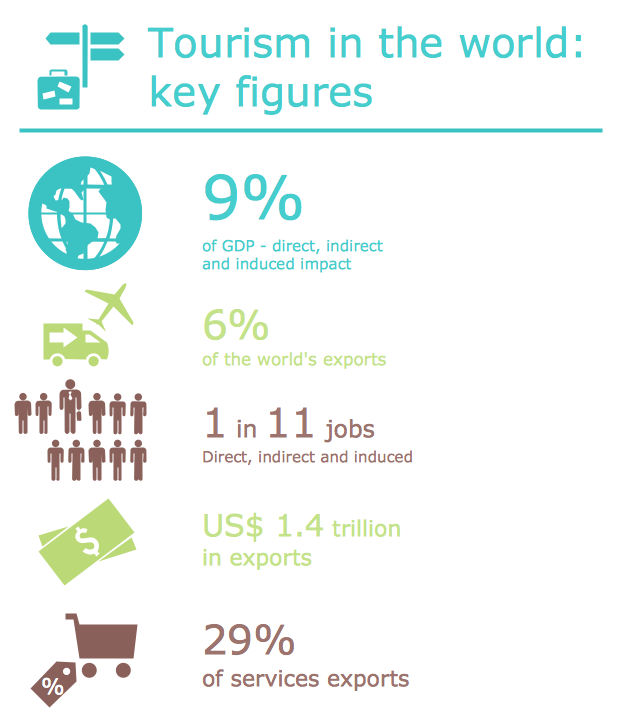
In the course of recent decades data visualization went through significant development and has become an indispensable tool of journalism, business intelligence and science. The way visual information may be conveyed is not limited simply to static or dynamic representation, it can also be interactive. Infographics can be conditionally divided into several general levels. Primarily, this is level of visualization of information, its interpretation and association on any ground. Second level can be defined as a visualization of knowledge, depiction of thoughts and ideas in the form of images or diagrams. Finally, the level of data visualization, which processes data arrays in charts, enabling the information to be more clearly perceived. You can also identify the main approaches to the creation of infographics: exploratory and narrative. Exploratory method insists on minimalist design in favor of data precision without unnecessary details and is common for scientific researches and ana
Picture: Design Pictorial Infographics. Design Infographics
Related Solution:
Visualizing sports statistics becomes as easy as never before with ConceptDraw DIAGRAM software extended with the Winter Sports solution. This solution delivers a complete set of winter sports illustrations, samples and templates you may use to visualize any kind of sports statistics in minutes.
Picture: Winter Sports. Illustrations and Visualize Statistics
Related Solution:
What is landscape design? It's a floor plan but for an outdoor area.
Same as a floor plan, a landscape design represents visually any site using scaled dimensions.
The main purpose of landscape design is to plan the layout for an outdoor area no matter is it a personal site plan for your home or a commercial plan for business. It may also be handful when a new installation, repair or even an outdoor event is planning.
It helps to calculate time and decide which materials should be used in your project. Landscape designs perfectly gives the property owner and landscape contractor better vision for cost estimation, helping to ensure the project time and budget.
Picture: How to Draw a Landscape Design Plan
Related Solution:
This sample was created in ConceptDraw DIAGRAM diagramming and vector drawing software using the Flowcharts solution from the Diagrams area of ConceptDraw Solution Park.
This sample shows the Flowchart that displays the procedures of 2PP (two-party preferred) voting and counting the voters. The two-party-preferred vote is the result of the elections that was distributed to the final two parties.
Picture: Basic Flowchart Images. Flowchart Examples
Related Solution:
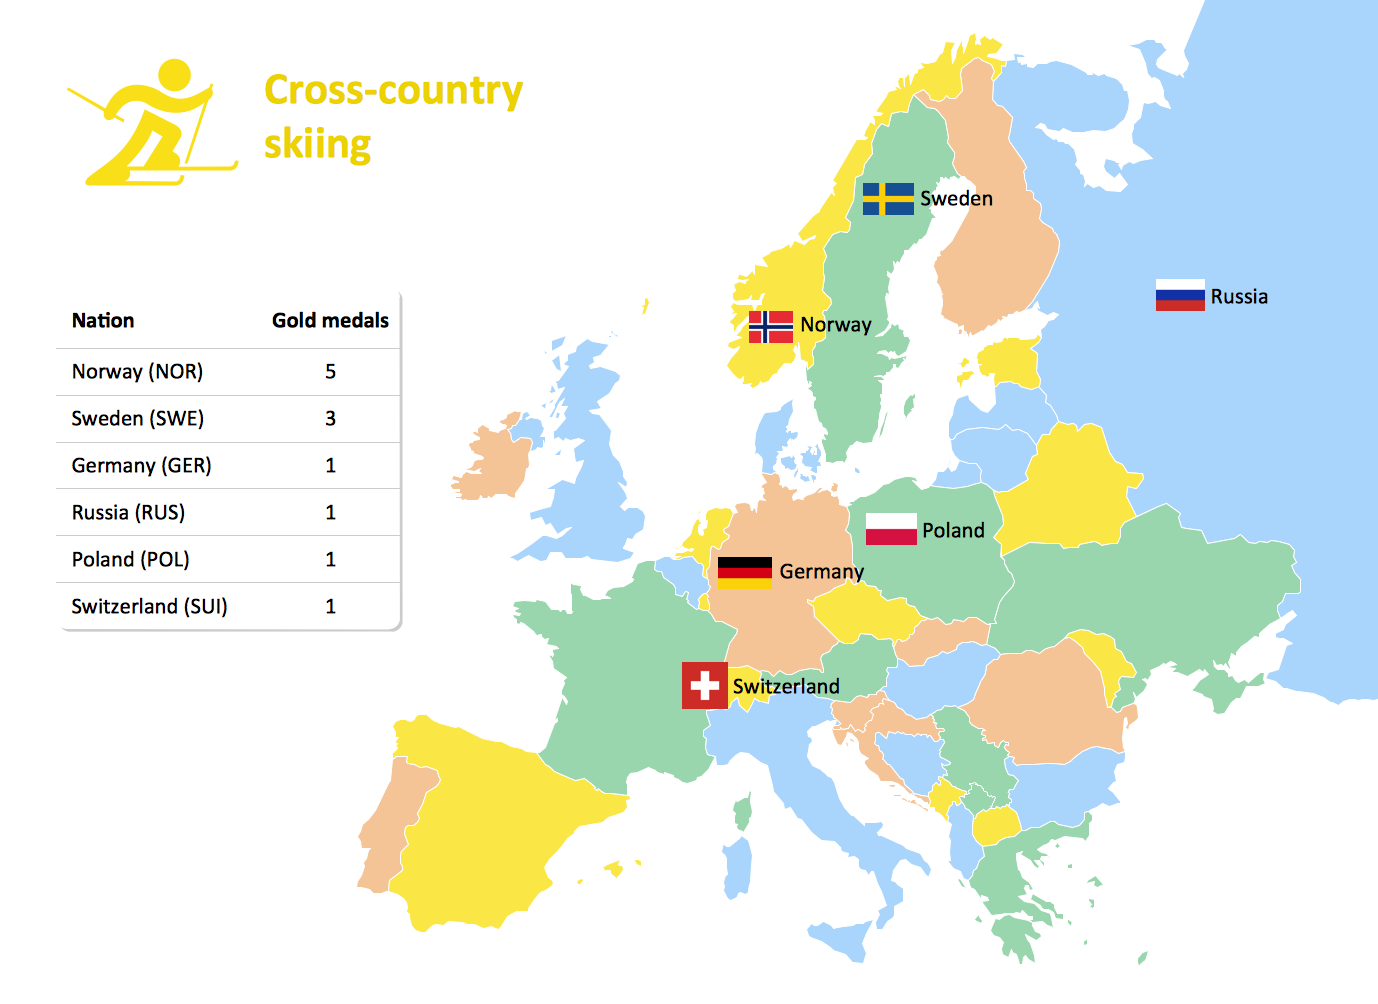
Do you like infographics and data visualization? Creating infographics is super-easy with ConceptDraw.
Picture: Winter Sports. Olympic Games Illustrations. Medal Summary
Related Solution:
Sports Selection Flow Chart - This sample was created in ConceptDraw DIAGRAM using the Flowcharts Solution from the Marketing Area and shows the Flow Chart of sport selection. An experienced user spent 10 minutes creating this sample.
Picture: Flow Chart for Olympic Sports
Related Solution:
Visualizing data in infographics format is a modern way to represent any statistics related to global sporting events, such as Winter Olympic Games. ConceptDraw DIAGRAM software extended with the Winter Sports solution delivers a rich set of samples and templates helps you produce all kind of sporting information, such as tournament schedule or medal table.
Picture: Winter Sports. Olympic Games Infographics. Medal Table
Related Solution:


