Wireframe Examples
ConceptDraw DIAGRAM is a powerful diagramming and vector drawing software. Extended with Website Wireframe solution from the Software Development area, ConceptDraw DIAGRAM became the ideal software for prototype and design professional looking websites wireframes. Website Wireframe solution offers at your disposal wide variety of wireframe examples and samples which confirm this.
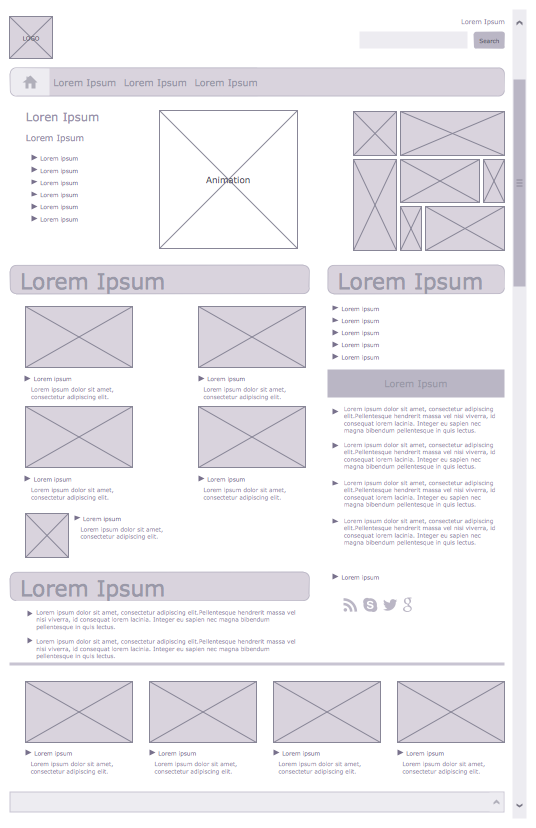
Example 1. Wireframe Examples - Company Website Home
Wireframe examples and samples included in Website Wireframe Solution were developed specially for ConceptDraw DIAGRAM users and are available for viewing and editing from ConceptDraw STORE. Each of them can become the good base for your own site wire frame.
ConceptDraw STORE is a powerful tool which offers at a glance the access to the whole diversity of ConceptDraw Solution Park libraries, templates and samples.

Example 2. Wireframe Examples - Multi-Author Blog
Thanks to the libraries of Website Wireframe Solution a website prototype or website wireframe of any complexity can be developed without efforts. You can easily verify this using a Website Wireframe solution!
Website Wireframe solution provides 7 libraries with numerous vector objects which are ideal for self-depending drawing. All that you need is simply drag appropriate objects from the libraries in your ConceptDraw document and arrange them according to your idea of website structure.

Example 3. Wireframe Examples - User Registration Form
The wireframe examples you see on this page were created in ConceptDraw DIAGRAM using the Website Wireframe Solution for ConceptDraw DIAGRAM software. These examples successfully demonstrate solution's capabilities and professional results you can achieve. An experienced user spent 15 minutes creating each of these samples.
Use the Website Wireframe Solution for ConceptDraw DIAGRAM software to create your own professional looking website wireframes and website designs of any complexity quick, easy and effective, and then successfully use them in your work activity.
All source documents are vector graphic documents. They are available for reviewing, modifying, or converting to a variety of formats (PDF file, MS PowerPoint, MS Visio, and many other graphic formats) from the ConceptDraw STORE. The Website Wireframe Solution is available for all ConceptDraw DIAGRAM users.
TEN RELATED HOW TO's:
As restaurant industry is growing rapidly nowadays, researches show that almost half of the adults have worked in a restaurant or a cafe. Moreover, many of them dream to start their own someday. Unfortunately, it takes a lot of time to write a business plan and to find a great location, although some know how to create a restaurant floor plan in minutes or how to plan budget effortlessly. Hiring employees can also cause a lot of headache, but this is crucial for further success, because every guest comes to restaurant for a good service and delicious food. It is also worth noting that restaurant concept is also important, because it defines target audience and influences the menu.
This diagram represents the floor plan of an ongoing sports-theme establishment - restaurant, cafe, or other food service. A number of widescreen monitors installed along the perimeter provide visitors the opportunity to follow the course of a match from anywhere in the dining room of restaurant or cafe. The most of sports fans believe that food and alcohol is a big part of any sports show. That is why the dining room takes the most space - almost 60% of the total establishment space. Nearly all sports fans consume beverages while watching sports - beer, soda or water at least. Thus, the restaurant floor plan designers added a large lavatory there. Moreover, project developers considered unnecessary the gender division of such delicate place - perhaps they guess that only men are watching football, or believe that alcohol will eliminate the most of gender differences.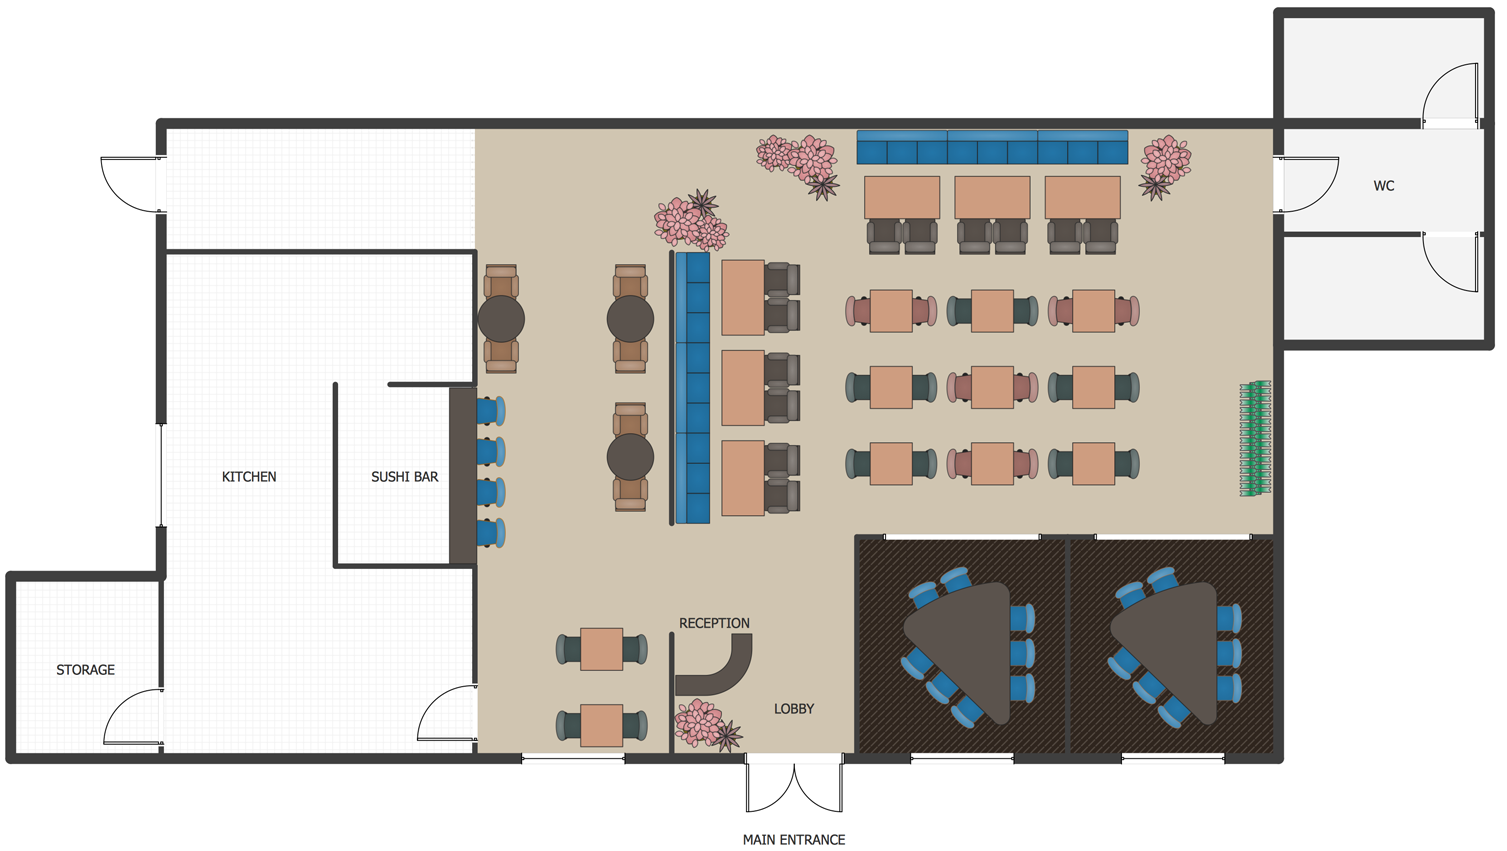
Picture: How To Create Restaurant Floor Plan in Minutes
Related Solution:
Wireless computer network diagrams help system administrators and network engineers to find out amount and type of equipment needed for each office LAN.
Picture: Wireless Network LAN
Related Solution:
ConceptDraw DIAGRAM diagramming and vector drawing software extended with Cisco Network Diagrams Solution from the Computer and Networks Area is the best for creating Cisco Network Diagrams thanks to numerous predesigned Cisco network icons.
Picture: Cisco Network Icons
Related Solution:
Download ConceptDraw diagram software for easy drawing.
Picture: The Best Choice for Creating Diagram
Related Solution:
ConceptDraw DIAGRAM diagramming and vector drawing software offers the Fault Tree Analysis Diagrams Solution from the Industrial Engineering Area of ConceptDraw Solution Park for quick and easy creating the Fault Tree Diagram of any degree of detailing.
Picture: Fault Tree Diagram
Related Solution:
How To Draw an iPhone? It's very fast and easy to draw an iPhone and design iPhone user interface using the tools of ConceptDraw DIAGRAM extended with iPhone User Interface Solution. iPhone User Interface Solution offers you the incredibly large quantity of predesigned objects that are grouped to 9 libraries: Apps Icons, Bars, Content Views, Controls, iMessage, iPhone 6 Mockup, Tab Bar Icons, Temporary Views, Toolbar and Navigation Bar Buttons.
Picture: How To Draw an iPhone?
Related Solution:
ConceptDraw Business Finance Illustration examples and libraries contain vector clip art for drawing different Business and Finance Illustrations. You may find Advertising example, Project Management example, Business Model example and many more.
Picture: Business and Finance Illustrations Example
Related Solution:
Jackson System Development (JSD) is a linear method of system development created by Michael A. Jackson and John Cameron in the 1980s. It comprises the whole software life cycle directly or providing a framework for more specialized techniques.
When implementing the Jackson System Development method and designing JSD diagrams, you can succesfully use the powerful and helpful tools of ConceptDraw DIAGRAM software extended with Entity-Relationship Diagram (ERD) solution from the Software Development area of ConceptDraw Solution Park.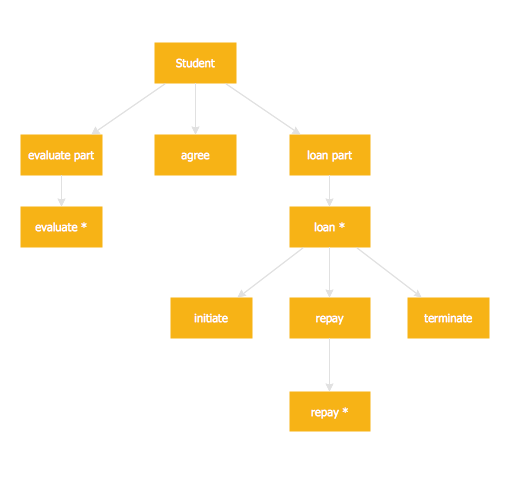
Picture: JSD - Jackson system development
Related Solution:

