Wireframe Tools
Website wireframe is incredibly useful prototyping tool, it helps in website creating and allows to visualize the end result long before the site will be ready. So wire frame allows to avoid mistakes, saves a lot of time and is an important starting point for complex project.
A wireframe is a design representation made with low accuracy. This is a scheme, which should clearly answer to three questions following questions about the future page: what content, where to place it and how to interact. Wireframe reflects the main group of content, shows the information structure and visualizes the basic the interaction between the interface and the user. Although wireframes seem to look like meaningless set of gray blocks, it's not exactly like that. It should be seen as a skeleton of your design and you should remember that wireframes should depict every important detail of the final product.
Representation is a key term, which will help you find the necessary balance between required precision and speed. Do not show too much detail, but on the other hand, you need to create an exact image of the final design of the product, so be careful not to miss any important details. A good wireframe is crucial for the entire team working on the project: developers, graphic designers, copywriters, project managers.
Wireframe can be compared to the map of a city. Each street is represented on the map, but its visual image is quite simplified. You can sense the architecture of the city, if you look at the map, but you can’t perceive its beauty.
Wireframes should be made quickly and you should spend almost all the time left communicating and discussing with the team. The average time to create a wireframe should be really limited. Visualization should be created according to the aesthetics rules but this is vastly simplified. You probably won’t use any other colors than black, gray and white.
Wireframes are commonly used as documentation for the project. Because of their static and fixed manner of displaying interfaces, they need to be suitably described (from a brief explanation up to a complex of technical documentation, if necessary).
Planning a website structure and developing its wireframe, creating a website prototype and drawing professional looking site designs never been easier than now with convenient and useful wireframe tools of Website Wireframe Solution from the Software Development area of ConceptDraw Solution Park.

Example 1. ConceptDraw DIAGRAM Wireframe Tools - Photogallery Webpage Wireframe
Wireframe tools make creating website easier and more efficient. Among the wireframe tools which offers a Website Wireframe Solution there are first of all 7 libraries with large quantity of predesigned vector objects, icons, controls, web widgets, and other graphic elements which were specially designed to give you the opportunity to create skeletal structure of a website in mere minutes.
All these objects are vector objects, you can resize them without loss of quality, arrange, rotate, combine, change their color, if needed.

Example 2. Website Wireframe Solution in ConceptDraw STORE
Website Wireframe solution contains also variety of samples and template which deserves particular attention. It is represented on the next image.

Example 3. Wireframe Tools - 960 Grid System 16-Column Layout
This template was created in ConceptDraw DIAGRAM using the tools of Website Wireframe Solution for ConceptDraw DIAGRAM Solution Park. It is included in Website Wireframe Solution, you can find and use this template from ConceptDraw Solution Park.
Use the Website Wireframe Solution for ConceptDraw DIAGRAM software to create your own professional looking website wireframes and designs of any complexity fast, easy and effective.
All source documents are vector graphic documents. They are available for reviewing, modifying, or converting to a variety of formats (PDF file, MS PowerPoint, MS Visio, and many other graphic formats) from the ConceptDraw STORE. The Website Wireframe Solution is available for all ConceptDraw DIAGRAM users.
TEN RELATED HOW TO's:
ConceptDraw DIAGRAM diagramming and vector drawing software supplied with Sales Dashboard solution provides the full set of useful tools which make it the best for producing the live KPI Dashboard of any complexity.
Picture: KPI Dashboard
Related Solution:
If you are just a beginner in drawing flowcharts, it may seem that a sheet of paper and a pen are just enough. However, at the time you would want to share your results, diagramming applications would suite you better. it’s very easy to create diagrams that way and to discover new kinds of flowcharts.
The huge collection of sample ConceptDraw diagrams, charts, illustrations and other types of business drawings includes a wide range of business themes. A huge number of graphic images of ConceptDraw documents is divides on business application areas according to business-oriented solutions for which they were made.Here is a short visual list of samples of flowcharts, process diagrams, UML models, management charts, computer network diagrams, maps, infographics, illustrations, etc. In short, each ConceptDraw solution is accompanied with at least ten samples representing some particular examples of the application of the given chart.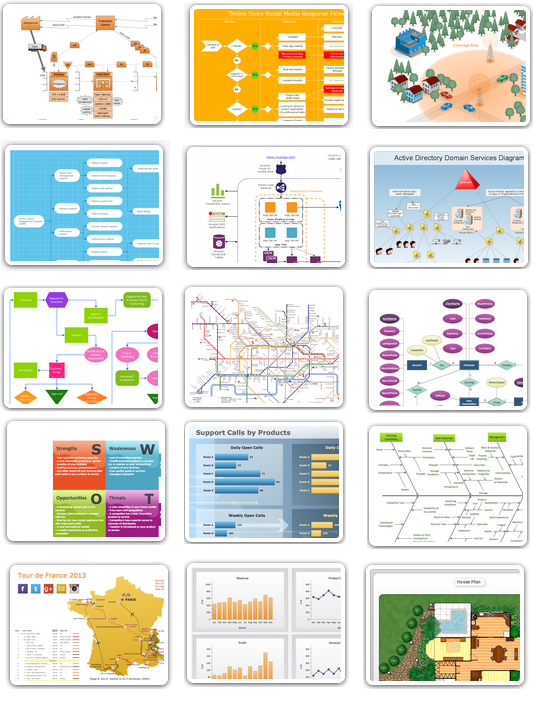
Picture: Applications
A model of a system is defined as a set of hierarchical diagrams representing the asynchronous process of data transformation from the moment it is input to the system to the moment it is output to the user. To demonstrate how a process transforms the initial data, you should design a data flow diagram using a DFD Library included in ConceptDraw DIAGRAM Solution Park. Start your diagramming experience now!
You can use this library of symbols related to data flow diagrams (DFD) to design data-oriented or process-oriented models along with data process diagrams. This vector objects library It is a part of ConceptDraw solution designed for data flow diagramming, along with corresponding samples and templates. A data flow diagram is a 2D flowchart that depicts the sequence of particular activities and operations operations and activities which is accompanied by the dynamic flow of some data.
Picture: Design Data Flow. DFD Library
Related Solution:
ConceptDraw is your tool for driving social integration and managing change across and streamline social media processes of your organisation.This tool keeps the entire team on the same page allowing you to realize your social media strategy, improve the quality of your answers, and minimize the time it takes to respond.
Picture: Social Media Response Management DFD Charts - software tools
Related Solution:
Planning a computer network can be a challenge for a junior specialist. However, knowing how to draw a computer network diagrams isn’t a rocket science anymore. There are a lot of special software for creating such diagrams with predesigned templates and examples.
The core for Network Fault Tolerance System presented here, is the equipment of Cisco. You can see here the certified Cisco equipment icons. Generally, ConceptDraw DIAGRAM libraries contain more than half of a thousand objects representing the standardized images of Cisco equipment. ConceptDraw solution for network diagramming is a great network diagramming tool for any level skills - from students to network guru.
Picture: How to Draw a Computer Network Diagrams
Related Solution:
Entity Relationship Diagram (ERD) is the world-known way to show the logical structure of databases in visual manner. The best software tool for drawing Entity-Relationship Diagram is ConceptDraw DIAGRAM vector graphics software with Entity-Relationship Diagram (ERD) solution from Software Development area which gives the ability to describe a database using the Entity-Relationship model. The vector graphic diagrams produced using this solution can be successfully used in whitepapers, presentations, datasheets, posters, or any technical materials.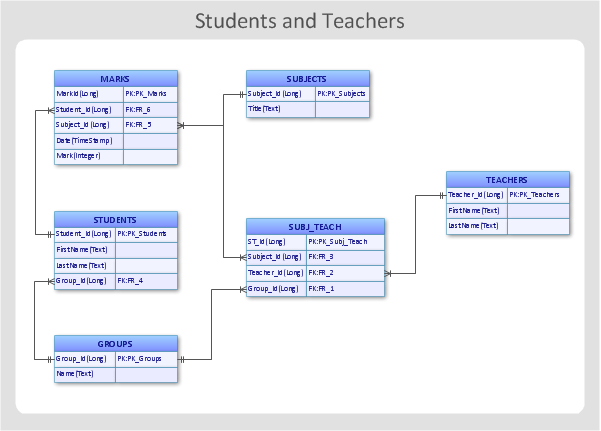
Picture: Entity-Relationship Diagram
Related Solution:
ConceptDraw DIAGRAM is a powerful diagramming and vector drawing software. Extended with Office Layout Plans Solution from the Building Plans Area, ConceptDraw DIAGRAM became the ideal software for making Office Floor Plans.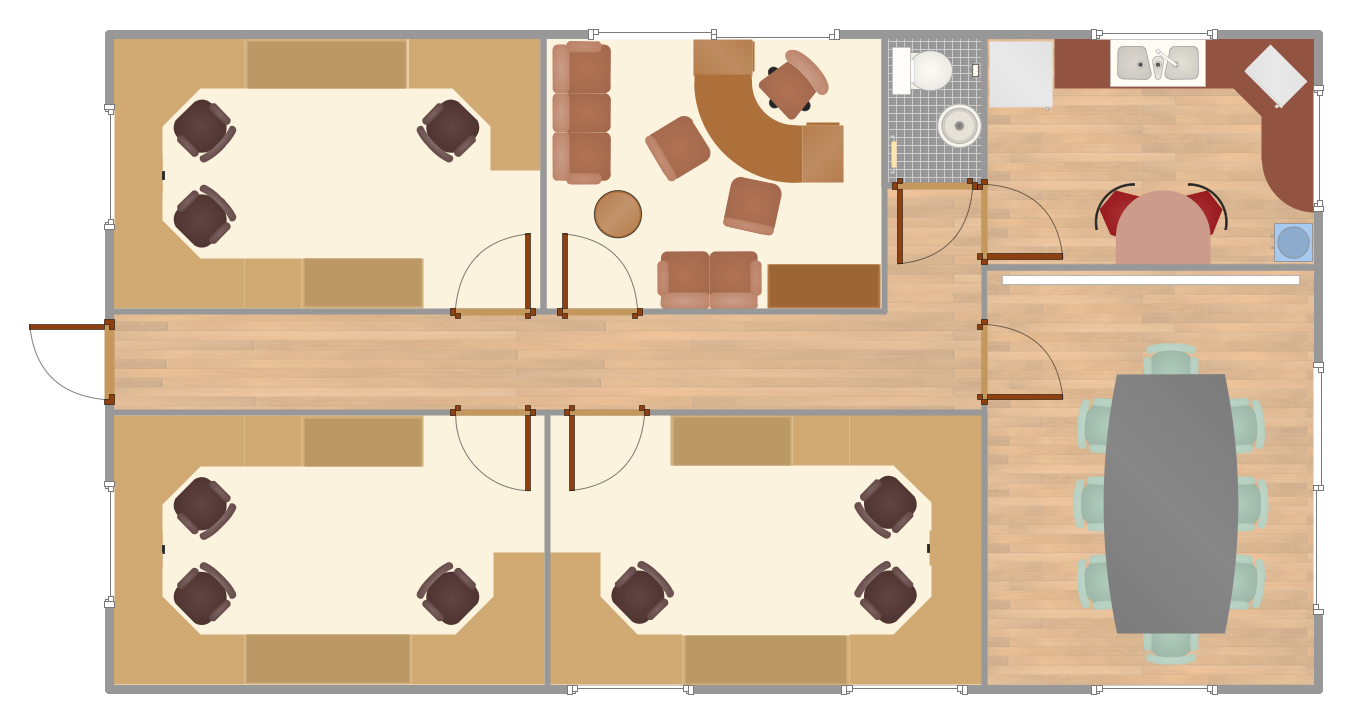
Picture: Office Floor Plans
Related Solution:
ConceptDraw DIAGRAM extended with Data Flow Diagrams solution is the best diagramming and vector drawing software for quick and easy designing the Data Flow Diagram Example of any complexity.
Picture: Data Flow Diagram Example
Related Solution:
There are a lot of structured analysis and design technique methodologies used to describe systems and data sources. To visualize data structures, data flow diagrams can be used for various purposes in the area of software engineering. Nowadays these diagrams are also used in the area of business analysis and information system analysis.
This data flow diagram depicts an account processing system of a typical account department of a small manufacturing enterprise. It shows the data transmission through the order processing to shipping verification. This data flow diagram was created according to standard of Yourdon and Coad notation. The vector graphic objects of Yourdon/Coad notation symbols was delivered by ConceptDraw Data Flow Diagrams solution. The current DFD can be employed as an example of a business process model, representing the set of business events and interactions commonly engaged in a accounts receivable process.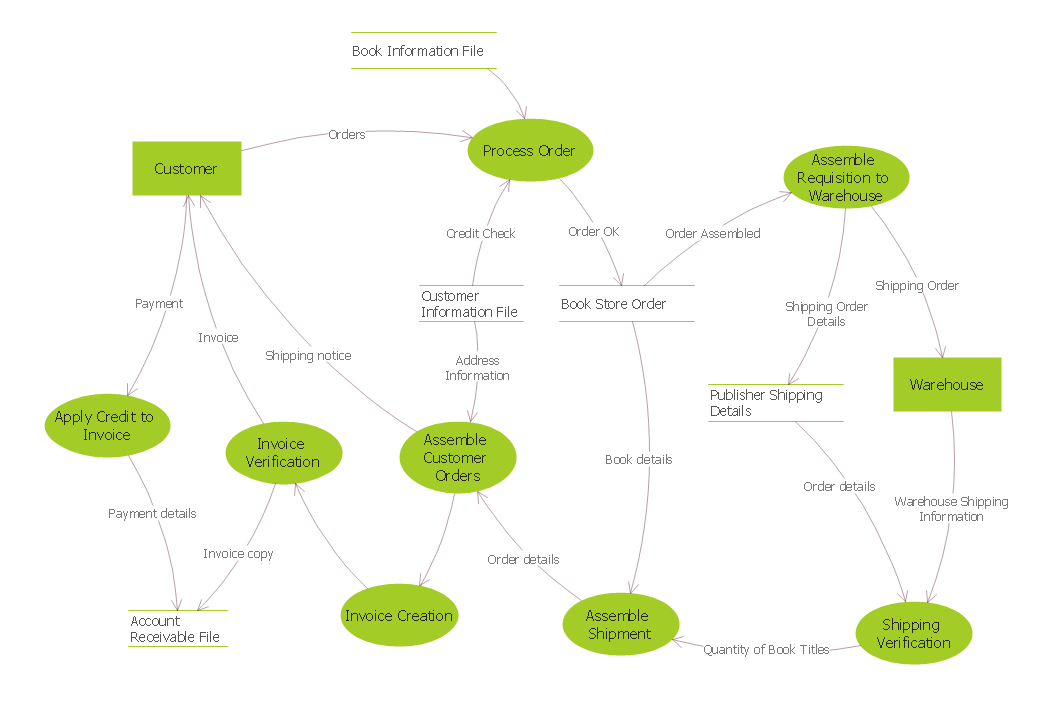
Picture: Data Flow Diagrams
Related Solution:
Collaborating with co-workers is very important, not only in order to get things done effectively, but also to keep in touch with the outside world. Great way for business collaboration is Skype.
Picture: Online Collaboration via Skype
Related Solution:


