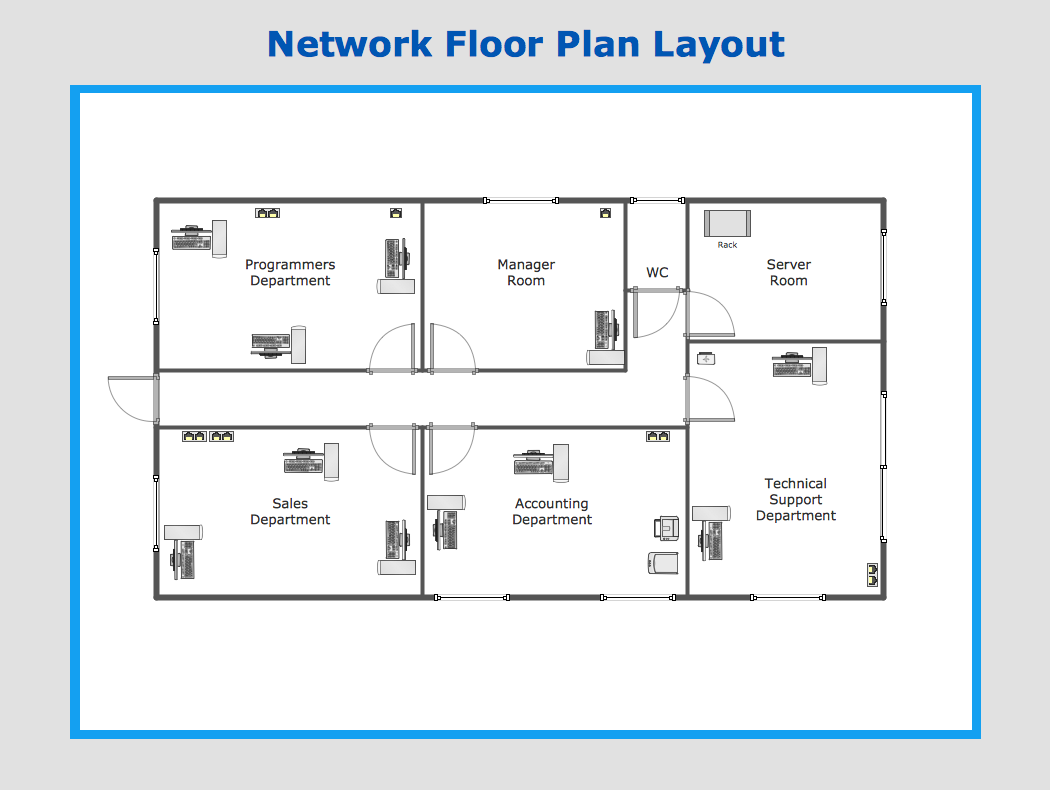
Network Layout Floor Plans
Network Layout Floor Plans solution extends ConceptDraw DIAGRAM software functionality with powerful tools for quick and efficient documentation the network equipment and displaying its location on the professionally designed Network Layout Floor Plans. Never before creation of Network Layout Floor Plans, Network Communication Plans, Network Topologies Plans and Network Topology Maps was not so easy, convenient and fast as with predesigned templates, samples, examples and comprehensive set of vector design elements included to the Network Layout Floor Plans solution. All listed types of plans will be a good support for the future correct cabling and installation of network equipment.
Electronic Block Diagrams
The Electronic Block Diagrams solution for ConceptDraw DIAGRAM includes a set of diagrams samples and a large number of specialized electronic and electrical symbols of electronic blocks, amplifiers, pulses, repeaters, converters, waveforms, electric filters, delay elements, etc. All symbols are highly simple and common for electronics. They allow designing strict and clear diagrams and electronics graphical designs for documentation, specifications, reports, presentation slides. Use them in electrical engineering, to design and construct electronic equipment, show sequence of pulses and flow of energy, and rapidly identify points of interest or trouble spots in electronic circuits.
How to create your UML Diagram
The UML diagrams in this Solution are divided into three broad categories: Structure Diagrams; Behavior Diagrams; Interaction Diagrams. The 13 diagrams contained in the Rapid UML Solution offer an essential framework for systems analysts and software architects to create the diagrams they need to model processes from the conceptual level on through to project completion. What is a Local Area Network? Examples of LAN Diagrams
Local Area Network (LAN) is a network which consists of computers and peripheral devices connected each other and to the local domain server, and covers a little territory or small number of buildings, such as home, school, laboratory, office, etc. LAN serves for few hundreds of users. It includes many cables and wires, and demands to design previously a Network diagram. All local area network devices can use the shared printers and disk storage.
ConceptDraw DIAGRAM is a perfect network diagramming software with examples of LAN Diagrams, templates and predesigned vector objects. ConceptDraw DIAGRAM is the ideal choice for network engineers and network designers who need to draw fast and easy Local Area Network Diagrams, for IT specialists, developers and other IT professionals which need to visualize the communication schemes of LAN and visually document the LAN's physical structure and arrangement in houses, offices and other buildings. Ready-to-use vector objects from Computer Network Diagrams solution will help you design LAN diagrams in minutes.
Bar Graphs
The Bar Graphs solution enhances ConceptDraw DIAGRAM functionality with templates, numerous professional-looking samples, and a library of vector stencils for drawing different types of Bar Graphs, such as Simple Bar Graph, Double Bar Graph, Divided Bar Graph, Horizontal Bar Graph, Vertical Bar Graph, and Column Bar Chart. You can construct your Bar Chart both vertically and horizontally, however, the vertical form is more common.
Design Element: Chen for Entity Relationship Diagram - ERD
Entity-Relationship Diagrams (ERDs) were developed and introduced as a convenient and visual tool for the data modeling, they are the perfect way for easy determining data and also relationships between them. The first standard notation for ERD was proposed by Chen. Chen's notation is very rich on the data modeling tools and standard notation symbols and elements for drawing easy understandable Entity-relationship diagrams, Attribute diagrams, Decomposition charts, which are especially popular for designing relational databases. The entity is the main term, it is a set of instances abstract or real objects with common characteristics or attributes. Any system's object is represented by one uniquely identified entity, relationships describe the links between the entities. ConceptDraw DIAGRAM diagramming software, which includes the Entity-Relationship Diagram (ERD) solution, offers all needed tools for professional drawing ER diagrams. Specially developed vector ERD design elements according to Chen and Crow's Foot notations are indispensible for professional ERDs design.This global vehicular network diagram sample represents the independent regional telematics network.
"Telematics typically is any integrated use of telecommunications and informatics, also known as ICT (Information and Communications Technology). Hence the application of telematics is with any of the following:
(1) The technology of sending, receiving and storing information via telecommunication devices in conjunction with affecting control on remote objects.
(2) The integrated use of telecommunications and informatics, for application in vehicles and with control of vehicles on the move.
(3) Telematics includes but is not limited to Global Positioning System technology integrated with computers and mobile communications technology in automotive navigation systems. ...
Practical applications of vehicle telematics:
1. Vehicle tracking is a way of monitoring the location, movements, status and behaviour of a vehicle or fleet of vehicles. ...
2. Trailer tracking is the technology of tracking the movements and position of an articulated vehicle's trailer unit...
3. Container tracking. Freight containers can be tracked by GPS...
4. Cold store freight trailers ... used to deliver fresh or frozen foods are ... incorporating telematics to gather time-series data on the temperature inside the cargo container...
5. Fleet management includes the management of ships and or motor vehicles such as cars, vans and trucks. Fleet ... Management can include ... vehicle telematics (tracking and diagnostics)...
6. Satellite navigation in the context of vehicle telematics is the technology of using a GPS and electronic mapping tool to enable the driver of a vehicle to locate a position, plan a route and navigate a journey.
7. Mobile data is the use of wireless data communications using radio waves to send and receive real time computer data to, from and between devices used by field based personnel. ...
8. Wireless vehicle safety communications telematics aid in car safety and road safety. ...
9. Emergency warning system for vehicles. Telematics ... are self-orientating open network architecture structures of variable programmable intelligent beacons ... to accord ... warning information with surrounding vehicles in the vicinity of travel, intra-vehicle, and infrastructure. ...
10. Intelligent vehicle technologies. Telematics comprise electronic ... devices ... to provide precision repeatability functions ... emergency warning validation performance reconstruction. ...
11. Car clubs. Telematics-enabled computers allow organizers to track members' usage and bill them on a pay-as-you-drive basis. ...
12. Auto insurance. The basic idea of telematic auto insurance is that a driver's behavior is monitored directly while the person drives and this information is transmitted to an insurance company." [Telematics. Wikipedia]
The example "Independent regional networks diagram" was created using the ConceptDraw PRO diagramming and vector drawing software extended with the Vehicular Networking solution from the Computer and Networks area of ConceptDraw Solution Park.
Flowchart Components
The ConceptDraw Flowchart component includes a set of samples and templates. This geathered as flowchart maker toolbox which focused on drawing flowcharts of any industry standards.Taxi Service Data Flow Diagram DFD Example
This sample shows the Data Flow Diagram of the Taxi Service and interactions between the Clients, Operators and Divers, as well as Orders and Reports databases.Data Flow Diagram Examples
Data flow diagrams (DFDs) are effective to reveal relationships among the various components in a program or system. This type of diagrams is an important and useful technique for modeling an information system, its process aspects, for showing a system as a single high-level process. DFD lets illustrate the flow of data, how the input data are transformed to output results across the sequence of functional transformations. DFD consists of four major components: entities, processes, data stores, data flows. When you need to draw a Data Flow Diagram the ConceptDraw DIAGRAM diagramming and vector drawing software extended with Data Flow Diagrams solution will be helpful for you. Providing numerous collection of Data Flow Diagram examples, samples, templates and ready-to-use vector DFD symbols, Data Flow Diagrams solution ensures you with all needed tools for easy designing DFDs according to Gane-Sarson or Yourdon-Coad notation on your choice. Any from offered predesigned DFD examples can become a perfect base for your own diagram.Chen ERD Diagram
The vector stencils library Chen ERD from the solution Entity-Relationship Diagrams (ERD) contains specific symbols of the Chen ERD notation including entity symbols and relationship symbols for ConceptDraw DIAGRAM diagramming and vector drawing software. The Entity-Relationship Diagrams (ERD) solution is contained in the Software Development area of ConceptDraw Solution Park.Database Flowchart Symbols
Data base diagrams describes inter-related data and tables. It describes roles and relationships, internal and external dependencies, data exchange conventions and structures of knowledge domain. ConceptDraw Software provides number of data-base chart libraries including major 49 vector symbols. Use these DFD flowchart symbol libraries to design data-base structure and models, use it to design data base process-oriented models, or simple data-oriented models. The are special drawing tools for making data flowcharts, data process diagrams, structured analysis diagrams, and information flow diagrams.Wireframing
Website wireframe is a detailed view of design or its skeleton. It shows all the important elements of the final website, the main groups of contents, information structure, describes the user's interaction with interface and its estimated visualisation. ConceptDraw DIAGRAM extended with Website Wireframe solution from the Software Development area is the best wireframing software. Using the wireframe tools, libraries of vector objects, template and examples which offers a Website Wireframe solution, you will easily design the websites wireframes of any complexity.DFD Flowchart Symbols
A Data Flow Diagram (DFD) is a graphical technique which allows effectively model and analyze the information processes and systems. The ability to fast and easy create the DFDs is made possible with Data Flow Diagrams solution from the Software Development area of ConceptDraw Solution Park. For designing the Data Flow Diagrams are used simple DFD flowchart symbols which are connected each other by arrows depicting the data flow from one step to another.Example of DFD for Online Store (Data Flow Diagram)
Data Flow Diagram (DFD) is a methodology of graphical structural analysis and information systems design, which describes the sources external in respect to the system, recipients of data, logical functions, data flows and data stores that are accessed. DFDs allow to identify relationships between various system's components and are effectively used in business analysis and information systems analysis. They are useful for system’s high-level details modeling, to show how the input data are transformed to output results via the sequence of functional transformations. For description of DFD diagrams are uses two notations — Yourdon and Gane-Sarson, which differ in syntax. Online Store DFD example illustrates the Data Flow Diagram for online store, the interactions between Customers, Visitors, Sellers, depicts User databases and the flows of Website Information. ConceptDraw DIAGRAM enhanced with Data Flow Diagrams solution lets you to draw clear and simple example of DFD for Online Store using special libraries of predesigned DFD symbols.Swim Lane Flowchart Symbols
Use the set of special professionally developed swim lane flowchart symbols - single, multiple, vertical and horizontal lanes from the Swimlanes and Swimlanes BPMN 1.2 libraries from the Business Process Diagram solution, the Swim Lanes library from the Business Process Mapping solution as the perfect basis for your Swim Lane Flowcharts of processes, algorithms and procedures.Product Proposal Template
This template was created in ConceptDraw DIAGRAM diagramming and vector drawing software using the Block Diagrams Solution from the “Diagrams” area of ConceptDraw Solution Park. This template shows the Product Proposal Diagram on that is displayed the sequence of the product planning steps. This diagram is convenient, visual and clear.Fault Tree Analysis Software
ConceptDraw DIAGRAM extended with Fault Tree Analysis Diagrams Solution from the Industrial Engineering Area of ConceptDraw Solution Park is the best Fault Tree Analysis Software. First of all, Fault Tree Analysis Diagrams Solution provides a set of samples which are the good examples of easy drawing professional looking Fault Tree Analysis Diagrams.ConceptDraw DIAGRAM
ConceptDraw DIAGRAM is a powerful business and technical diagramming software tool that enables you to design professional-looking graphics, diagrams, flowcharts, floor plans and much more in just minutes. Maintain business processes performance with clear visual documentation. Effectively present and communicate information in a clear and concise manner with ConceptDraw DIAGRAM.The vector stencils library "Computers" contains 52 computer hardware icons.
Use it to design your audio, video and multimedia illustrations, presentations, web pages and infographics with ConceptDraw PRO diagramming and vector drawing software.
"Computer hardware (or simply hardware in computing contexts) is the collection of physical elements that constitutes a computer system. Computer hardware is the physical parts or components of a computer, such as the monitor, keyboard, computer data storage, hard disk drive (HDD), graphic cards, sound cards, memory (RAM), motherboard, and so on, all of which are tangible physical objects." [Computer hardware. Wikipedia]
The clipart example "Computers" is included in the Audio, Video, Media solution from the Illustrations area of ConceptDraw Solution Park.
- Mention 10 Examples Of Ict Gadget
- Telecommunication Network Diagrams | 10 Example Of Ict
- Network Layout | Network Security Diagrams | 10 Examples Of Ict
- 10 Examples Of Ict Gadget
- 10 Example Of Ict Gadget
- Give 10 Examples Of Common Ict Gadgets
- SWOT Analysis | Give 10examples Of Common Ict
- Local area network (LAN). Computer and Network Examples ...
- Computer Network Diagrams | List Ten 10 Examples Of Ict
- How to Create Digital Media Infographics Using ConceptDraw PRO ...