 Education Package
Education Package is a comprehensive set of multifarious graphical solutions from ConceptDraw Solution Park, collected together in help to ConceptDraw PRO users working in a field of science, education and training, which is aimed at improving the quality of education and helping to design with ease variety of interesting and colorful educational materials, diagrams, charts and maps. Use it to present the information and knowledge in an interesting, clear, structured and simple form to achieve a success in education and pedagogy, to maintain the interest of students and pupils throughout the whole learning process, at the lectures, lessons and even during independent work with additional materials, to contribute to better perception of scientific information by listeners during the conferences and reports.
 Business Package for Management
Package intended for professional who designing and documenting business processes, preparing business reports, plan projects and manage projects, manage organizational changes, prepare operational instructions, supervising specific department of an organization, workout customer service processes and prepare trainings for customer service personal, carry out a variety of duties to organize business workflow.
 Packages Area
We are excited to introduce a new Bundles Catalogue, where ConceptDraw products are paired together or offered with thematic set of paid solutions.
 Fishbone Diagram
Fishbone Diagrams solution extends ConceptDraw PRO software with templates, samples and library of vector stencils for drawing the Ishikawa diagrams for cause and effect analysis.
 Basic Pie Charts
This solution extends the capabilities of ConceptDraw PRO v10.3.0 (or later) with templates, samples, and a library of vector stencils for drawing pie and donut charts.
HelpDesk
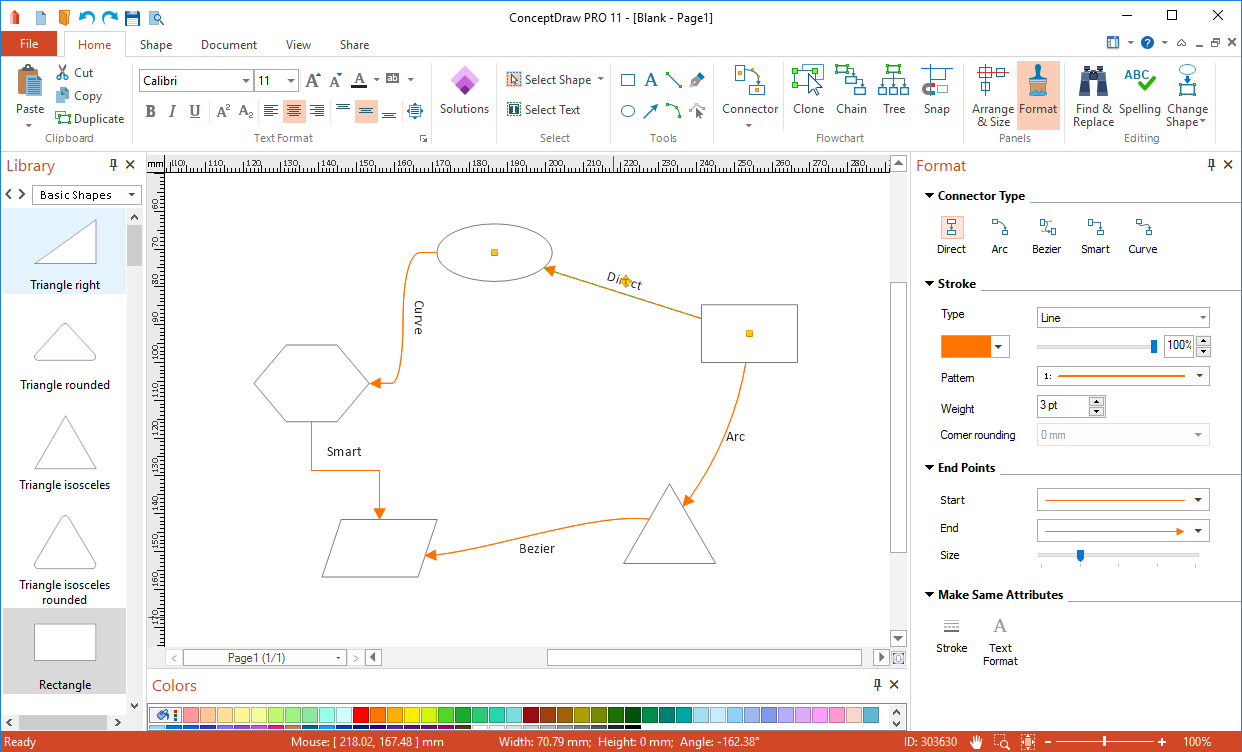
How to Connect Objects on PC
ConceptDraw PRO provides a few options for drawing connections between objects: Direct Connectors, Smart, Arc, Bezier, Curve and Round Connectors. You can connect objects in your ConceptDraw diagram with proper connectors using the embedded automatic connection modes. This article describes how you can connect objects with connectors and how you can ascribe different types and behaviors.
 Website Wireframe
The innovative Website Wireframe solution enhances the ConceptDraw PRO v10 functionality with newest wireframe tools, libraries with variety of predesigned icons, symbols, buttons, graphics, forms, boxes, and many other vector elements, templates and professionally designed samples, which make it the best wireframing software. Website Wireframe solution gives you significant advantages when designing and maintaining websites, creating skeletal and content-free depictions of website structure, making website prototypes and planning the content arrangement before committing to design, also speeds up the processes of sketching, producing and sharing wireframe examples of website style and interface design.
 Pie Charts
Pie Charts are extensively used in statistics and business for explaining data and work results, in mass media for comparison (i.e. to visualize the percentage for the parts of one total), and in many other fields. The Pie Charts solution for ConceptDraw PRO v10 offers powerful drawing tools, varied templates, samples, and a library of vector stencils for simple construction and design of Pie Charts, Donut Chart, and Pie Graph Worksheets.
 Chemical and Process Engineering
This chemical engineering solution extends ConceptDraw PRO v.9.5 (or later) with process flow diagram symbols, samples, process diagrams templates and libraries of design elements for creating process and instrumentation diagrams, block flow diagrams (BFD
- Circular arrows diagrams - Vector stencils library | How to Draw the ...
- Basic Flowchart Symbols and Meaning | Arrow circle chart ...
- Pie Chart Examples and Templates | Arrow circle chart - Template ...
- Circular Arrow | How to Draw a Circular Arrows Diagram Using ...
- Arrow circle chart - Template | Basic Flowchart Symbols and ...
- Arrow circle chart - Template | Pie Chart Examples and Templates ...
- Divided bar diagrams - Vector stencils library | Divided bar diagrams ...
- Circle Charts
- 8 Arrow Circle
- Circle Arrow For Infographic Ppt
- Schematic Circle Symbol
- Progress Bar Circle With Arrow
- Triangle scheme with arrows - Template | Circular Flow Diagram ...
- Circular diagrams - Vector stencils library | Circles Venn Diagram ...
- Circle Bullets
- How to Create a Pie Chart | Circular arrows diagrams - Vector ...
- National Preparedness Cycle - Arrow ring chart | Circular diagrams ...
- Vector Circle Venn Diagram Meaning
- Chart With Arrows
- 3 Circle Venn Diagram Vector
