2 Circle Venn Diagram. Venn Diagram Example
Using the ready-to-use predesigned objects, samples and templates from the Venn Diagrams Solution for ConceptDraw PRO you can create your own professional looking Venn Diagrams quick and easy.The vector stencils library "Industrial equipment" contains 81 symbols of pumps, compressors, fans, turbines, and power generators.
Use these shapes to design pumping systems, air and fluid compression systems, and industrial process diagrams in the ConceptDraw PRO software extended with the Chemical and Process Engineering solution from the Chemical and Process Engineering area of ConceptDraw Solution Park.
www.conceptdraw.com/ solution-park/ engineering-chemical-process
The vector stencils library "Industrial equipment" contains 81 symbols of pumps, compressors, fans, turbines, and power generators.
Use these shapes to design pumping systems, air and fluid compression systems, and industrial process diagrams in the ConceptDraw PRO software extended with the Chemical and Process Engineering solution from the Chemical and Process Engineering area of ConceptDraw Solution Park.
www.conceptdraw.com/ solution-park/ engineering-chemical-process
The vector stencils library "Circular diagrams" contains 42 templates of circular diagrams: circular arrow diagram, circular motion diagram, arrow ring chart, doughnut chart (donut chart), circle pie chart, diamond pie chart, circle diagram, pie chart, ring chart, loop diagram, block loop diagram, arrow loop circle, crystal diagram, triangular diagram, diamond diagram, pentagon diagram, hexagon diagram, heptagon diagram, cycle diagram (cycle chart), stacked Venn diagram (onion diagram), arrow circle diagram.
Use these shapes to illustrate your marketing and sales documents, presentations, webpages and infographics in the ConceptDraw PRO diagramming and vector drawing software extended with the Target and Circular Diagrams solution from the Marketing area of ConceptDraw Solution Park.
www.conceptdraw.com/ solution-park/ marketing-target-and-circular-diagrams
Basic Flowchart Symbols and Meaning
Flowcharts are the best for visually representation the business processes and the flow of a custom-order process through various departments within an organization. ConceptDraw PRO diagramming and vector drawing software extended with Flowcharts solution offers the full set of predesigned basic flowchart symbols which are gathered at two libraries: Flowchart and Flowcharts Rapid Draw. Among them are: process, terminator, decision, data, document, display, manual loop, and many other specific symbols. The meaning for each symbol offered by ConceptDraw gives the presentation about their proposed use in professional Flowcharts for business and technical processes, software algorithms, well-developed structures of web sites, Workflow diagrams, Process flow diagram and correlation in developing on-line instructional projects or business process system. Use of ready flow chart symbols in diagrams is incredibly useful - you need simply drag desired from the libraries to your document and arrange them in required order. There are a few serious alternatives to Visio for Mac, one of them is ConceptDraw PRO. It is one of the main contender with the most similar features and capabilities.
Venn Diagram
Venn diagrams are illustrations used in the branch of mathematics known as set theory. They show the mathematical or logical relationship between different groups of things (sets). A Venn diagram shows all the possible logical relations between the sets."Markings.
Lines.
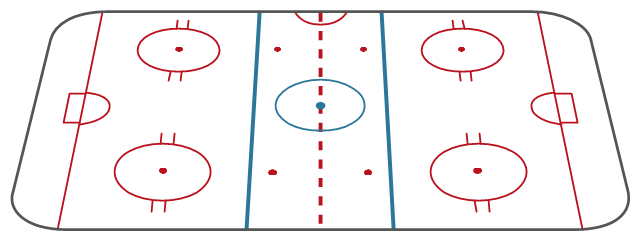
The centre line divides the ice in half crosswise. It is used to judge icing, meaning that if a team sends the puck across the centre line (red line), blue line and then across the goal line (that is to say, shoots or dumps the puck past the goal line from behind their own side of the centre line) it is said to be icing. ...
Faceoff spots and circles.
There are 9 faceoff spots on a hockey rink. Most faceoffs take place at these spots. There are two spots in each end zone, two at each end of the neutral zone, and one in the centre of the rink.
There are faceoff circles around the centre ice and end zone faceoff spots. There are hash marks painted on the ice near the end zone faceoff spots. The circles and hash marks show where players may legally position themselves during a faceoff or in game play. ...
Spot and circle dimensions.
Both the center faceoff spot and center faceoff circle are blue. The spot is a solid blue circle 12 inches (30 cm) in diameter. Within the spot is a center, a circle 30 feet (9.1 m) in diameter, painted with a blue line 2 inches (5.1 cm) in width.
All of the other faceoff spots have outlines 2 inches (5.1 cm) thick, forming a circle 2 feet (0.61 m) in diameter measured from the outsides of the outlines, and are filled in with red in all areas except for the 3 inches (7.6 cm) space from the tops and bottoms of the circles, measured from the insides of the outline. ...
Goal posts and nets.
At each end of the ice, there is a goal consisting of a metal goal frame and cloth net in which each team must place the puck to earn points. According to NHL and IIHF rules, the entire puck must cross the entire goal line in order to be counted as a goal. ...
Goal area.
The crease is a special area of the ice designed to allow the goaltender to perform without interference. In most leagues, goals are disallowed if an attacking player enters the goal crease with a stick, skate, or any body part before the puck. For the purposes of this rule, the crease extends vertically from the painted lines to the top of the goal frame. ...
Goaltender trapezoid.
During the 2004-05 American Hockey League (AHL) season, an experimental rule was implemented for the first seven weeks of the season, instituting a goaltender trap zone, more commonly called the trapezoid in reference to its shape. Under the rule, it is prohibited for the goaltender to handle the puck anywhere behind the goal line that is not within the trapezoidal area. If they do so they are assessed a minor penalty for delay of game. ...
Referee's crease.
The referee's crease is a semicircle ten feet in radius in front of the scorekeepers bench." [Ice hockey rink. Wikipedia]
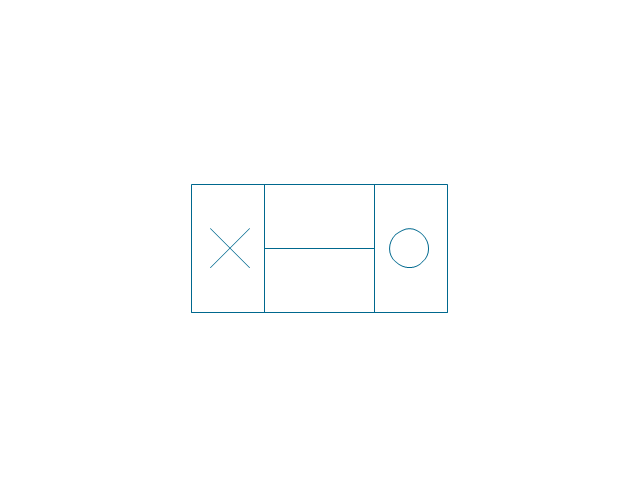
The diagram template "Ice hockey rink view from long side" for the ConceptDraw PRO diagramming and vector drawing software is included in the Hockey solution from the Sport area of ConceptDraw Solution Park.
Basic Circles Venn Diagram. Venn Diagram Example
Venn Diagrams visualize all possible logical relations between several sets and are widely used in mathematics, logic, statistics, marketing, sociology, etc. This Venn Diagram shows the relative complement of the set A with respect to the set B. It is the set of the elements in B, but not in A. In other words it is the set-theoretic difference B-A.Circle Spoke Diagram Template
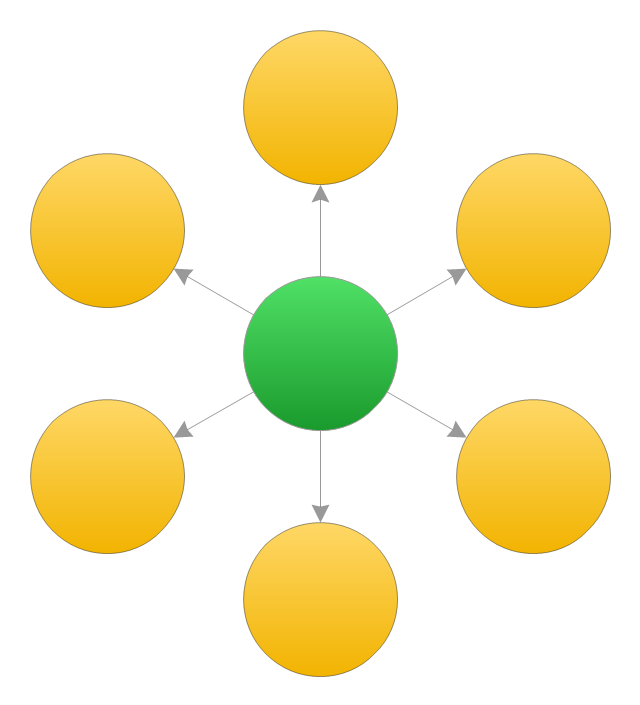
ConceptDraw PRO diagramming and vector drawing software offers the Circle Spoke Diagram Template included in the Circle-Spoke Diagrams Solution from the "Diagrams" Area. Use of ready template is the easiest way of drawing professional looking Circle-Spoke Diagrams.3 Circle Venn. Venn Diagram Example
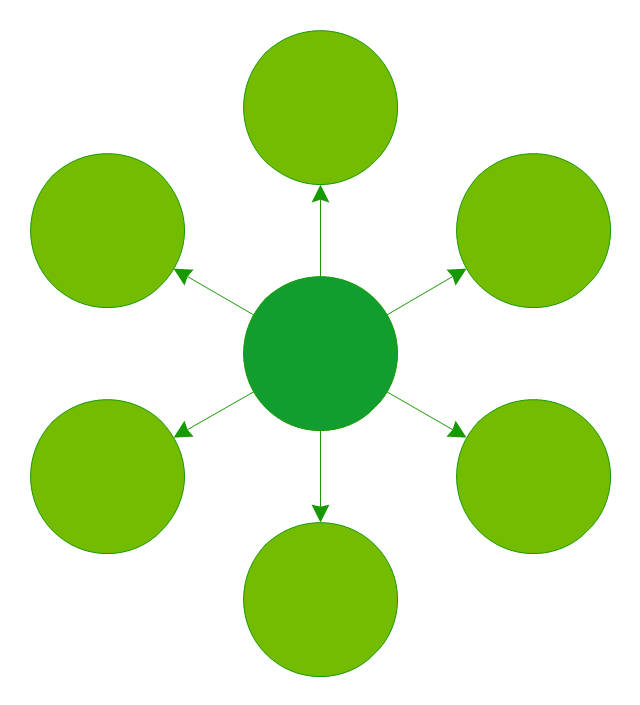
This example shows the 3 Circle Venn Diagram. The Venn Diagrams visualize all possible logical intersections between several sets. On this example you can see the intersections of 3 sets. Venn Diagrams are widely used in mathematics, logic, statistics, marketing, sociology, etc.The vector stencils library "Circle-spoke diagram" contains 8 templates of circle-spoke diagrams.
Use these shapes to draw your circle spoke diagrams in the ConceptDraw PRO diagramming and vector drawing software extended with the Circle-Spoke Diagrams solution from the area "What is a Diagram" of ConceptDraw Solution Park.
Use these shapes to draw your circle spoke diagrams in the ConceptDraw PRO diagramming and vector drawing software extended with the Circle-Spoke Diagrams solution from the area "What is a Diagram" of ConceptDraw Solution Park.
Circles Venn Diagram
This example shows the 4 Circle Venn Diagram. The Venn Diagram visualizes all possible logical relations between several sets. The sets are represented as circles on the Venn Diagram. On this example you can see the intersections of 4 sets. Venn Diagrams are widely used in mathematics, logic, statistics, marketing, sociology, etc.- Venn Diagram Maker 2 Circles
- Venn Diagrams Examples 2 Circles
- 2 Circle Venn Diagrams
- Solving Venn Diagrams With 2 Circles
- Free Euler Diagram Template 2 Circles
- Printable Venn Diagram 2 Circles
- Circles Venn Diagram
- Venn Diagram Creator 2 Circles
- Free Venn Diagram Template 2 Circles
- Create A Euler Diagram Online 2 Circles
- 3 Circle Venn Diagram. Venn Diagram Example | 2 Circle Venn ...
- 3 Circle Venn Diagram. Venn Diagram Example | Venn Diagram ...
- 2 -Set Venn diagram - Template | Venn diagrams - Vector stencils ...
- Circular diagrams - Vector stencils library | Circles Venn Diagram ...
- Circles Venn Diagram | Venn Diagram Template | Venn Diagram | 4 ...
- Example Of Sets For 3 Circles
- Screw conveyor 2
- 3 Circle Venn Diagram Template
- Industrial equipment - Vector stencils library
- 4 Circle Venn Diagram Problems And Solutions

