 Scrum Workflow
The Scrum Workflow Solution extends the capabilities of ConceptDraw DIAGRAM with a large collection of professionally-designed samples and a selection of ready-to-use scrum design elements: scrum diagrams and arrows, scrum icons of people, artifacts, workflow, workspace and other colorful scrum clipart, and also scrum charts.
Donut Chart Templates
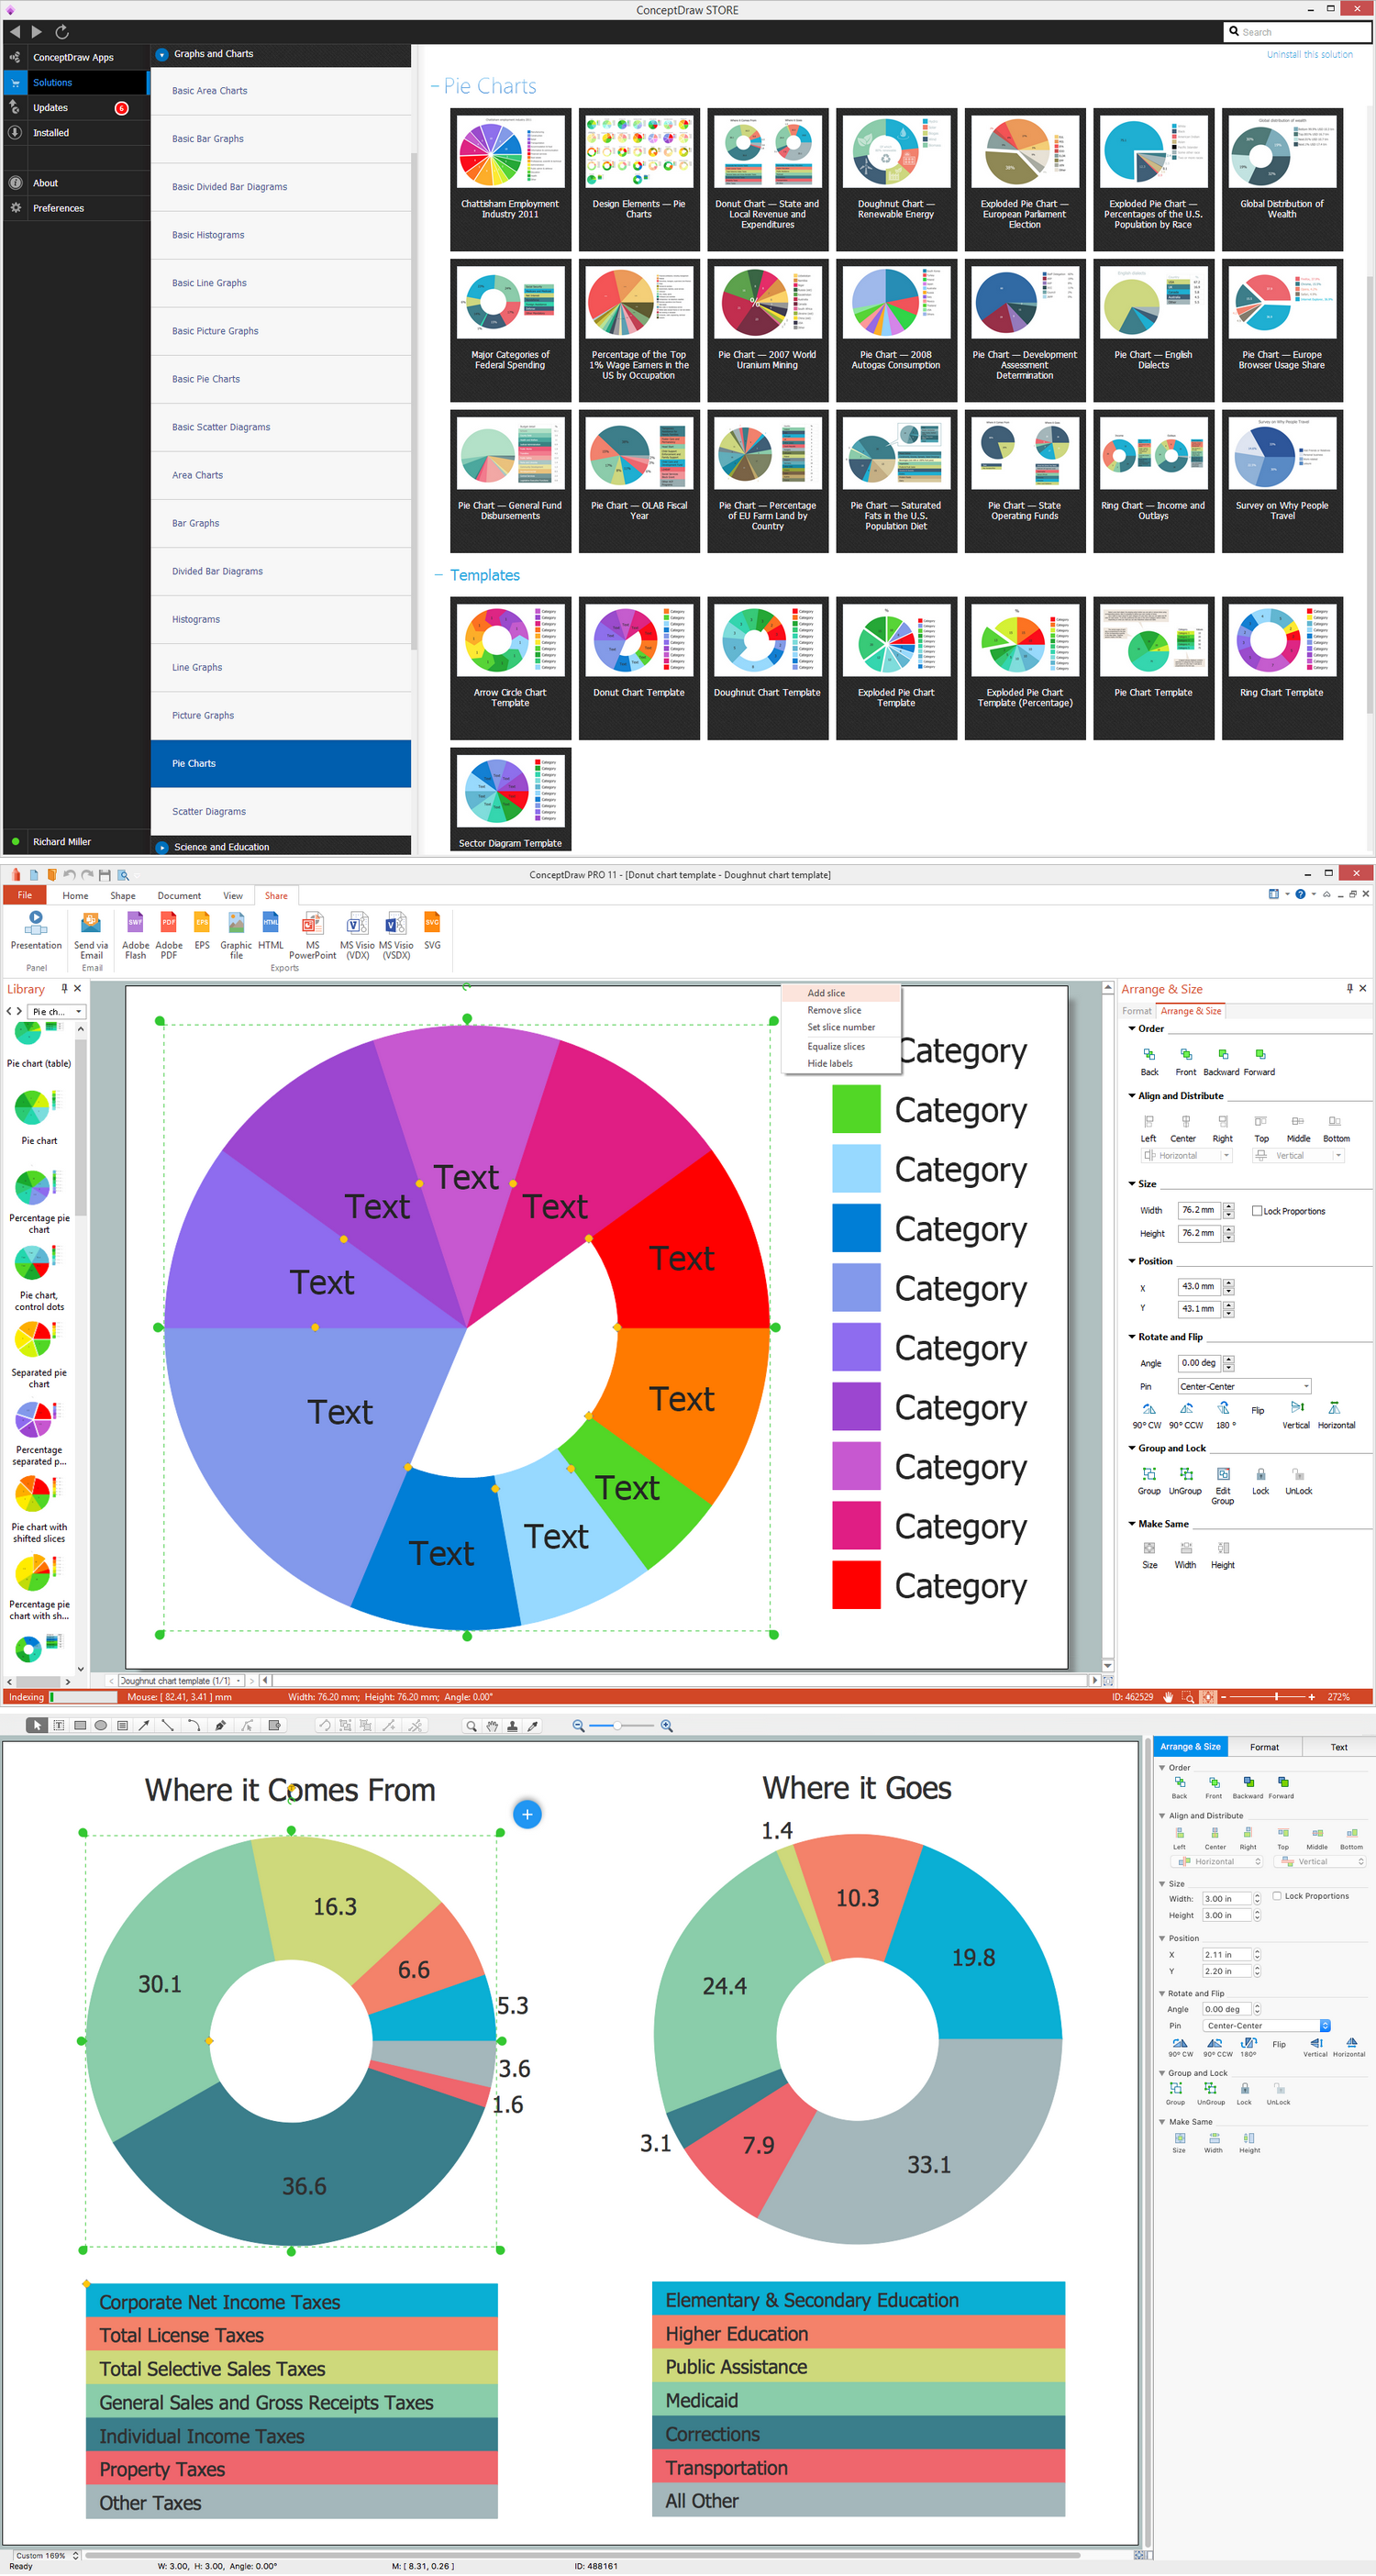
These donut chart templates was designed using ConceptDraw DIAGRAM diagramming and vector drawing software extended with Pie Charts solution from Graphs and Charts area of ConceptDraw Solution Park. All these donut chart templates are included in the Pie Charts solution. You can quickly rework these examples into your own charts by simply changing displayed data, title and legend texts.Classroom Seating Chart
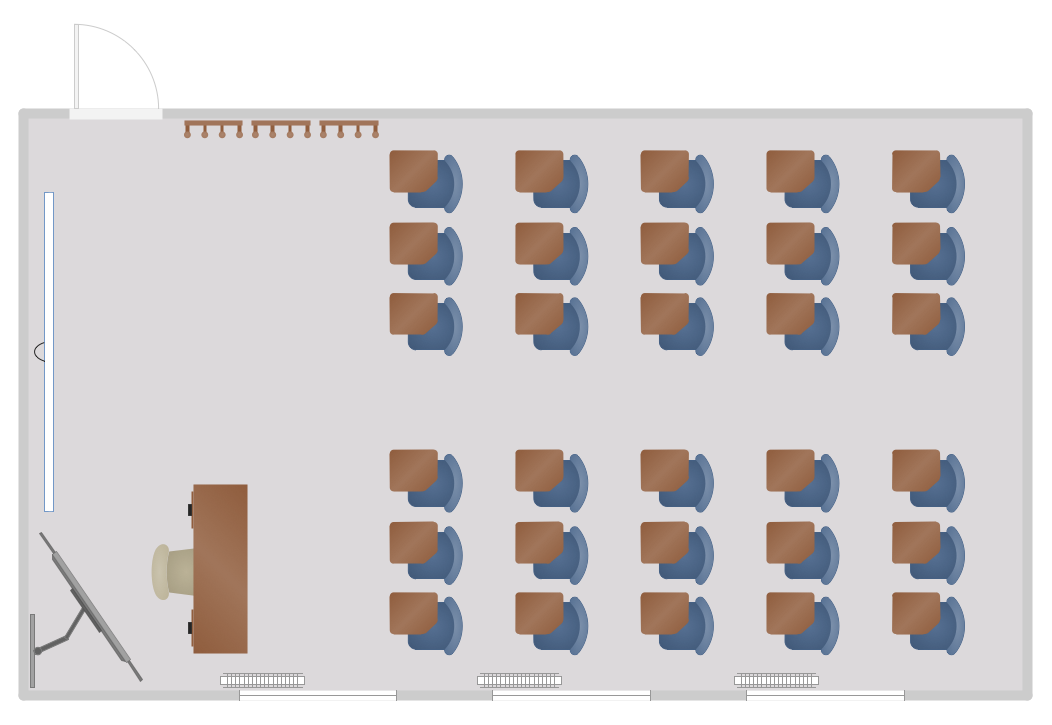
When developing the Classroom Seating Chart it is necessary to take into account the characteristics of the taken premises. Each seating place must to be comfortable and each pupil must to see good the teacher and the chalkboard. Let's design the Classroom Seating Chart in ConceptDraw DIAGRAM software extended with School and Training Plans Solution from the Building Plans Area.
 Health Food
The Health Food solution contains the set of professionally designed samples and large collection of vector graphic libraries of healthy foods symbols of fruits, vegetables, herbs, nuts, beans, seafood, meat, dairy foods, drinks, which give powerful possi
 Fault Tree Analysis Diagrams
This solution extends ConceptDraw DIAGRAM.5 or later with templates, fault tree analysis example, samples and a library of vector design elements for drawing FTA diagrams (or negative analytical trees), cause and effect diagrams and fault tree diagrams.
Competitor Analysis
Competitor analysis is a first and obligatory step in elaboration the proper corporate marketing strategy and creating sustainable competitive advantage. Use powerful opportunities of numerous solutions from ConceptDraw Solution Park for designing illustrative diagrams, charts, matrices which are necessary for effective competitor analysis.
 Stakeholder Onion Diagrams
The Stakeholder Onion Diagrams solution supplies ConceptDraw DIAGRAM with powerful tools to simplify the process of creating Stakeholder Onion Diagrams. It includes the set of pre-made vector objects and templates for a quick start, and collection of examples illustrating the solution's power. This solution is useful for all specialists in management and business, especially for those who prefer to use the newest progressive tools.
 iPhone User Interface
In order to draw the iPhone-related illustrations mentioning this phone’s capabilities, the ConceptDraw DIAGRAM charting and drawings software is used. Having all the basic tools from the mentioned application and those from the iPhone User Interface solution it becomes possible to create the needed drawing within only a few minutes as the solution contains a wide range of the pre-made samples and templates of the iPhone-related drawings and the vector stencils libraries that support iPhone 6 UI diagrams.
 Timeline Diagrams
Timeline Diagrams solution extends ConceptDraw DIAGRAM diagramming software with samples, templates and libraries of specially developed smart vector design elements of timeline bars, time intervals, milestones, events, today marker, legend, and many other elements with custom properties, helpful for professional drawing clear and intuitive Timeline Diagrams. Use it to design simple Timeline Diagrams and designate only the main project stages, or highly detailed Timeline Diagrams depicting all project tasks, subtasks, milestones, deadlines, responsible persons and other description information, ideal for applying in presentations, reports, education materials, and other documentation.
 SYSML
SYSML
In order to make a SysML-related drawing, the ConceptDraw DIAGRAM charting and drawing software can be used. Also, the SysML solution can be found as an extension to the ConceptDraw DIAGRAM application, enabling all those with systems engineering background to use the offered tools for creating the needed systems process models in order to use in the professional documentation for either distribution or analysis. Offering the vector stencil libraries full of the icons that may relate to each of the 9 official diagrams used in SysML, the SysML solution is useful for many system engineers.
 Oil and Gas
The Oil and Gas solution for ConceptDraw DIAGRAM software provides vector libraries of oil and gas symbols and a collection of samples for quick and simple designing of the oil and gas industry infographics, illustrations, presentations, diagrams. The resulting oil and gas graphics and illustrations help to clearly and quickly detail complex information. They are ideal for reporting on the development of best practices in oil and gas exploration and production. Use them to illustrate growth strategies and trends in the oil industry, conduct analysis, forecast the energy industry, and present the results of international energy forums.
How To Draw an iPhone?
How To Draw an iPhone? It's very fast and easy to draw an iPhone and design iPhone user interface using the tools of ConceptDraw DIAGRAM extended with iPhone User Interface Solution. iPhone User Interface Solution offers you the incredibly large quantity of predesigned objects that are grouped to 9 libraries: Apps Icons, Bars, Content Views, Controls, iMessage, iPhone 6 Mockup, Tab Bar Icons, Temporary Views, Toolbar and Navigation Bar Buttons.
 Electrical Engineering
The Electrical Engineering solution is known to be extending the ConceptDraw DIAGRAM application with a wide range of electrical schematic symbols, electrical engineering examples, electrical diagram symbols, the pre-made templates and stencil libraries full of the electrical engineering-related design elements. All listed can help all the ConceptDraw DIAGRAM users to design the needed electrical schematics, either analog or digital logic, wiring and circuit schematics and diagrams, maintenance and repair diagrams and power systems diagrams so they can be used both in the electronics and electrical engineering field of business activity.
- Percentages of the U.S. population by race | Pie Charts | Picture ...
- | Picture Graphs | Manufacturing and Maintenance | Examplesd ...
- Design Pictorial Infographics. Design Infographics | Healthy Food ...
- How to Connect Text Data to a Time Series Chart on Your Live ...
- How to Create a Bar Chart | How to Create a Column Chart ...
- Healthy Diet Plan | Food Pictures | Healthy Diet | Images For ...
- Energy Pyramid Diagram | Healthy Foods | How to Create ...
- Fruit Art | Example of DFD for Online Store (Data Flow Diagram ...
- Healthy Diet Plan | Healthy Diet | Food Pictures | Diet Chart Draw ...
- Healthy Diet Plan | Food Pictures | Pictures of Food | Diet Chart ...


