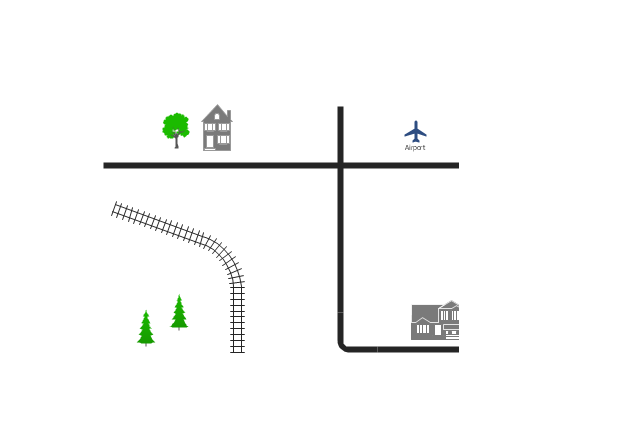
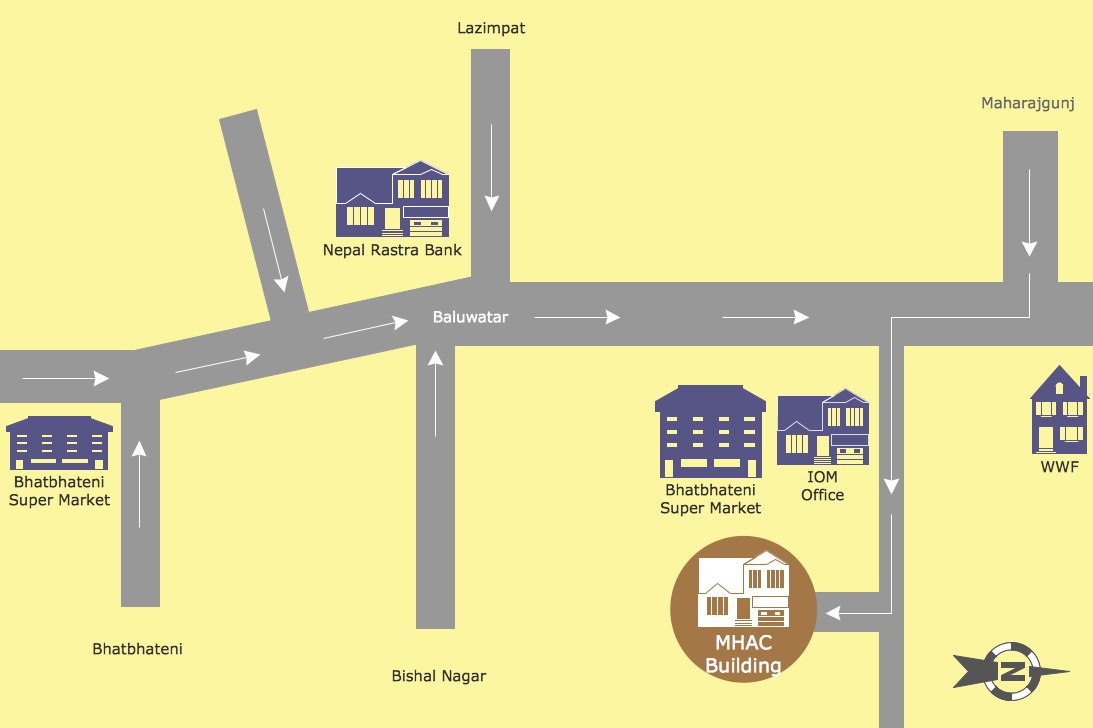
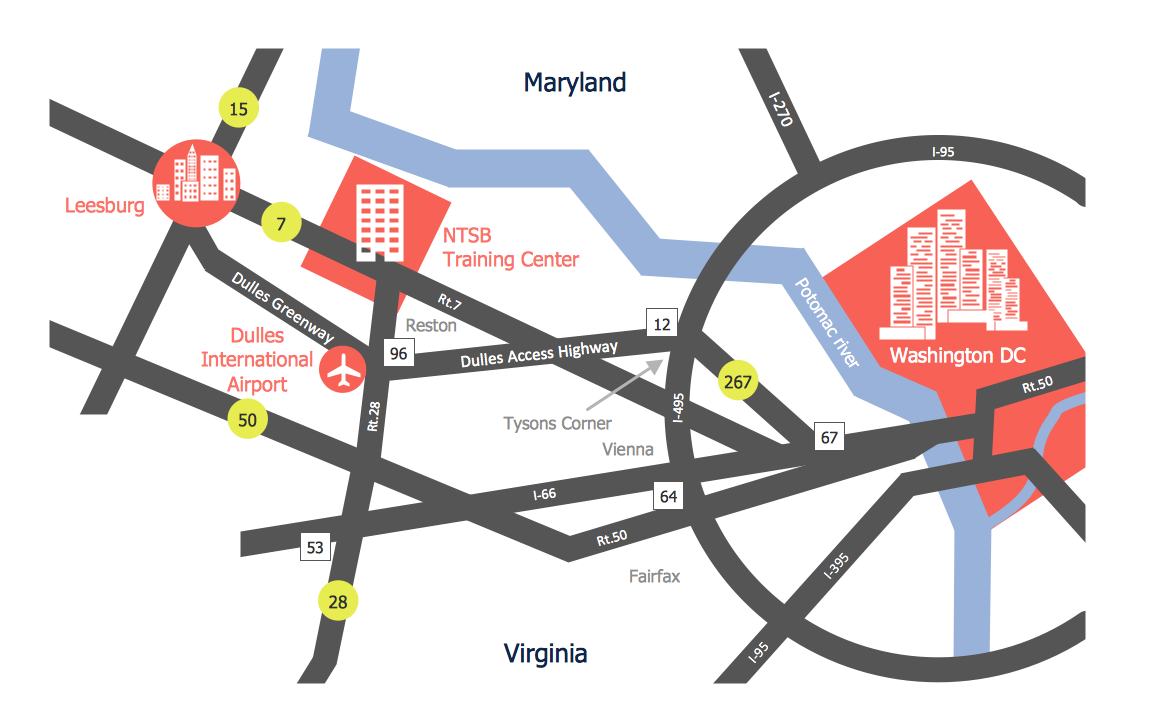
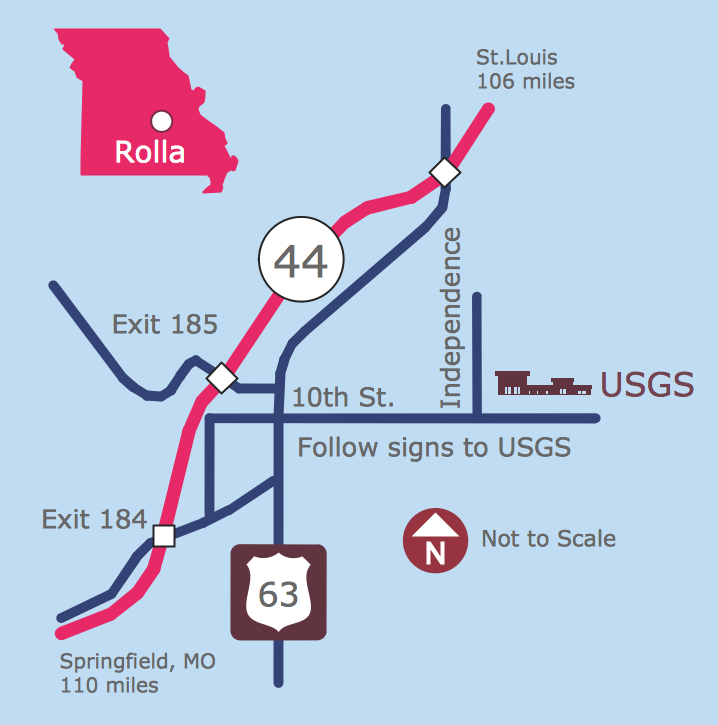
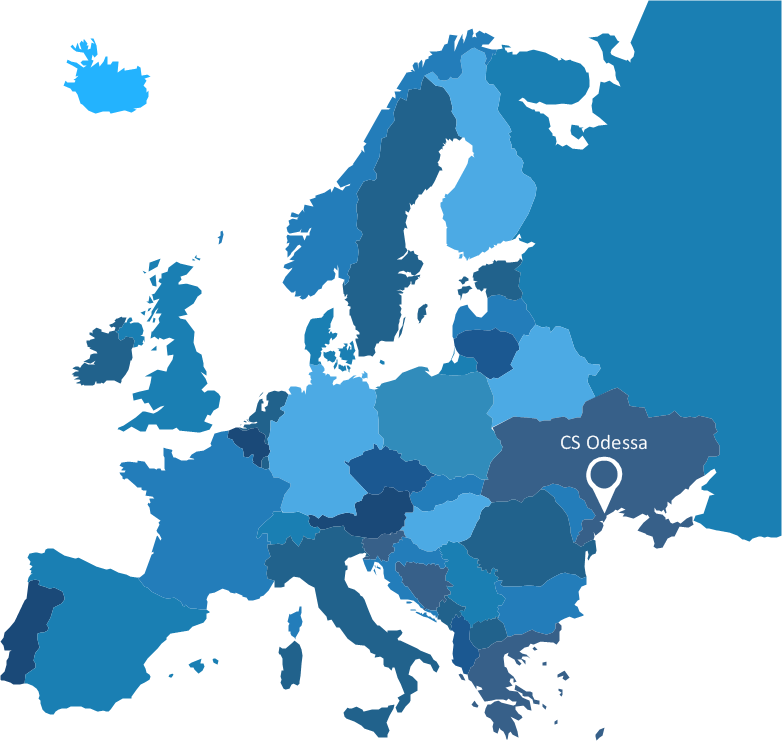
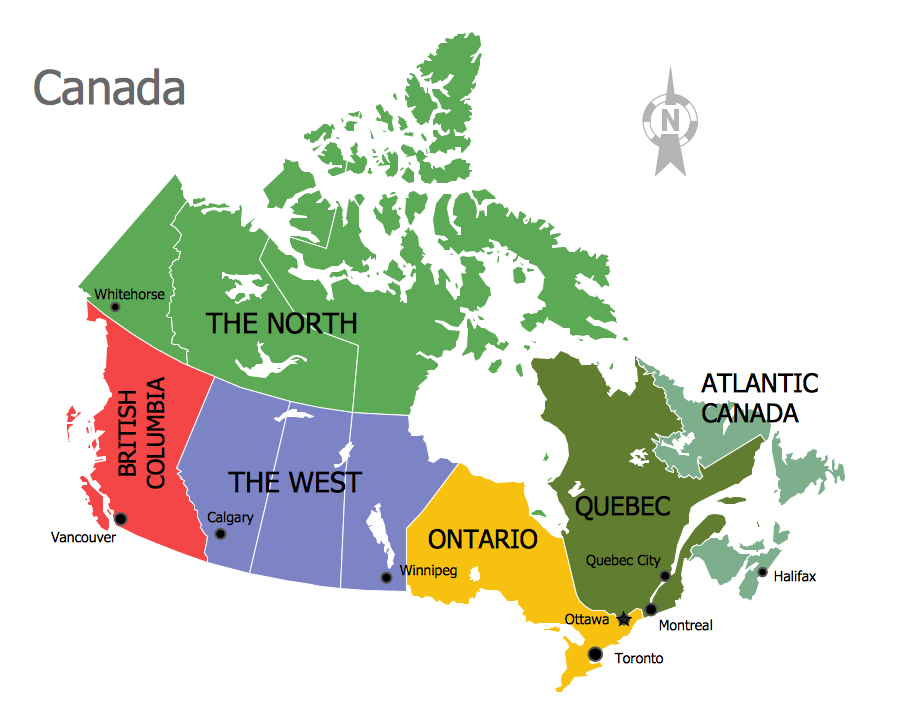
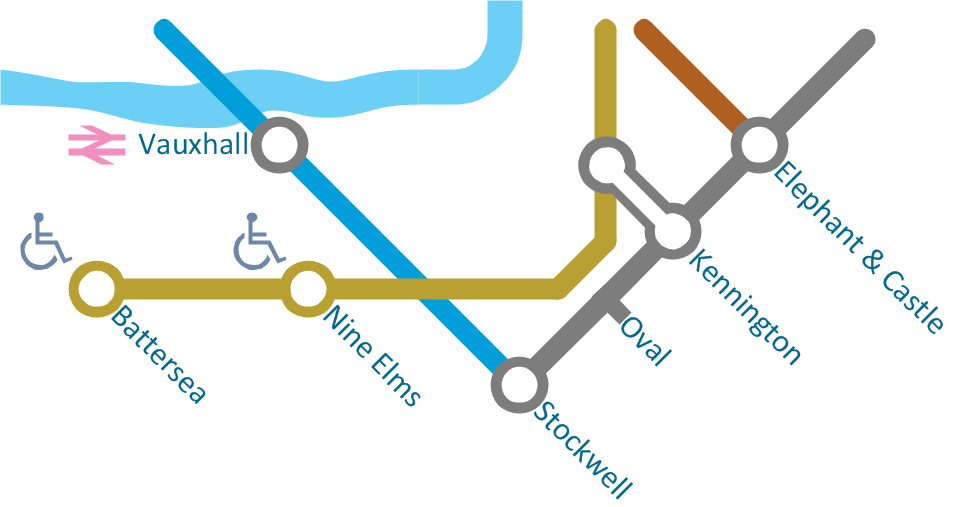
Use this template for creating the directional maps, location plans, site schemes, transit schemes, road maps, route maps.
"A road map or route map is a map that primarily displays roads and transport links rather than natural geographical information. It is a type of navigational map that commonly includes political boundaries and labels, making it also a type of political map. In addition to roads and boundaries, road maps often include points of interest, such as prominent businesses or buildings, tourism sites, parks and recreational facilities, hotels and restaurants, as well as airports and train stations. A road map may also document non-automotive transit routes, although often these are found only on transit maps." [Road map. Wikipedia]
This template for the ConceptDraw PRO diagramming and vector drawing software is included in the Directional Maps solution from the Maps area of ConceptDraw Solution Park.
 Directional Maps
Directional Maps solution extends ConceptDraw DIAGRAM software with templates, samples and libraries of vector stencils for drawing the directional, location, site, transit, road and route maps, plans and schemes.
Map Directions
ConceptDraw DIAGRAM software extended with Directional Maps Solution from the Maps Area of ConceptDraw Solution Park offers you the set of useful tools for easy drawing map directions, directional maps, road maps, navigation schemes, transit maps of any complexity, etc.Directions Maps
It is convenient to represent various routes, directions, roads on the directional maps and navigation schemes. ConceptDraw DIAGRAM diagramming and vector drawing software supplied with Directional Maps Solution from the Maps Area of ConceptDraw Solution Park is effective for drawing Directions Maps.Maps and Directions
ConceptDraw DIAGRAM diagramming and vector drawing software extended with Directional Maps Solution from the Maps Area of ConceptDraw Solution Park is a powerful maps and directions design software. Let's review the tools of this solution.Business diagrams & Org Charts with ConceptDraw DIAGRAM
The business diagrams are in great demand, they describe the business processes, business tasks and activities which are executed to achieve specific organizational and business goals, increase productivity, reduce costs and errors. They let research and better understand the business processes. ConceptDraw DIAGRAM is a powerful professional cross-platform business graphics and business flowcharting tool which contains hundreds of built-in collections of task-specific vector stencils and templates. They will help you to visualize and structure information, create various Business flowcharts, maps and diagrams with minimal efforts, and add them to your documents and presentations to make them successful. Among them are Data flow diagrams, Organization charts, Business process workflow diagrams, Audit flowcharts, Cause and Effect diagrams, IDEF business process diagrams, Cross-functional flowcharts, PERT charts, Timeline diagrams, Calendars, Marketing diagrams, Pyramids, Target diagrams, Venn diagrams, Comparison charts, Analysis charts, Dashboards, and many more. Being a cross-platform application, ConceptDraw DIAGRAM is very secure, handy, free of bloatware and one of the best alternatives to Visio for Mac users.
Examples of Flowcharts, Org Charts and More
ConceptDraw DIAGRAM covers a broad spectrum of business graphics categories and offers at ConceptDraw STORE enormous online collection of pictorial examples and samples for different thematics and application areas. It is a plentiful source of inspiration and wonderful examples of professionally designed diagrams, flowcharts, UML diagrams, organizational charts, databases, ERDs, network diagrams, business charts, different thematic charts, schematics, infographics and plans developed specially for knowledge workers, engineers, managers, businessmen, marketing specialists, analytics, scientists, students, professors, journalists and also for a large number of other people that every day use various diagrams and drawings in their work and life activity. Each of these examples is a real art, all they are well thought-out and designed without efforts with help of powerful tools of ConceptDraw DIAGRAM software. ConceptDraw examples display all variety of tasks, possibilities and results that ConceptDraw Product Line lets achieve fast and easy. ConceptDraw is one of the best Visio alternatives for Mac. It open all Visio formats like.vsdx,.vss,.vdx files and allows you to export files to Visio formats.
Visualization Spatial Data Using Thematic Maps Combined with Infographics
Now anyone can build an infographics from their data using ConceptDraw. Nice and simple, but the features it have are power-packed!
 Soccer
The Soccer (Football) Solution extends ConceptDraw DIAGRAM.5 (or later) software with samples, templates, and libraries of vector objects for drawing soccer (football) diagrams, plays schemas, and illustrations. It can be used to make professional looking
Continents Map
Designing of Continents Map is a quite complex and labour-intensive process. But now we have a way to make it easier - ConceptDraw DIAGRAM diagramming and vector drawing software extended with useful drawing tools of Continent Maps Solution from the Maps Area.Spatial Infographics
Not everyone can make spatial infographics from scratch, ConceptDraw will help you to create your own infographics.Map Infographic Creator
Follow samples and map templates to create nfographic maps. It's super-easy!Tools to Create Your Own Infographics
Over the past few centuries, data visualization has evolved so much that we use it every day in all areas of our lives. Many believe that infographic is an effective tool of storytelling, as well as analytics, and that it is able to overcome most of the language and educational barriers. Understanding the mechanisms of human perception will help you to understand how abstract forms and colors used in data visualization can transmit information more efficient than long paragraphs of text.
 Basic Line Graphs
This solution extends the capabilities of ConceptDraw DIAGRAM (or later) with templates, samples and a library of vector stencils for drawing Line Graphs.
 Computer and Network Package
Computer and Network Package is a large set of valuable graphical solutions from ConceptDraw Solution Park, developed and specially selected to help computer network specialists and IT professionals to realize their daily work the most efficiently and quickly. This package contains extensive set of graphic design tools, ready-to-use vector elements, built-in templates and samples for designing professional-looking diagrams, charts, schematics and infographics in a field of computer network technologies, cloud computing, vehicular networking, wireless networking, ensuring networks security and networks protection. It is useful for designing different floor plans and layout plans for homes, offices, hotels and instantly construction detailed schemes of computer networks and wireless networks on them, for making professional-looking and colorful Pie Charts, Bar Graphs and Line Charts visualizing the relevant information and data.
- Directional Maps | How to Create a Directional Map Using ...
- 2D Directional map - Template | Maps Driving Directions ...
- 2D Directional map - Template | Map Directions | Maps and ...
- 2D Directional map - Template | Map Directions | Directions Map | 2d ...
- 2D Directional map - Template
- 2D Directional map - Template | Landscape Architecture with ...
- 2D Directional map - Template | 2d Town With Road
- 2D Directional map - Template | Map Directions | Directions Map | 2d ...
- 2D Directional map - Template | Map Directions | Maps and ...
- Design elements - Vehicles 2D , 3D | Directional Maps | Road ...
- 2D Directional map - Template | Landmarks - Vector stencils library ...
- Conference centre location map | Directional Maps | 2D Directional ...
- 2D Directional map - Template | Map Directions | Brilliant Examples ...
- 2D Directional map - Template | SWOT analysis for a small ...
- How To use House Electrical Plan Software | Directional Maps ...
- Location of the Migration Health Assessment Center (MHAC) | 2D ...
- 2D Directional map - Template | Rail transport - Vector stencils ...
- Design elements - 3D directional maps | Design elements - Vehicles ...
- 3D pictorial road map | 2D Directional map - Template | Design ...
