 Engineering
This solution extends ConceptDraw PRO v9.4 with the ability to visualize industrial systems in electronics, electrical, chemical, process, and mechanical engineering.
HelpDesk
How to Create a Bar Chart in ConceptDraw PRO
Bar charts (bar graphs) are diagrams displaying data as horizontal or vertical bars of certain heights. Bar charts are widely used to show and compare the values of the same parameters for different data groups. The bar graph can be vertical or horizontal. This depends on the amount of categories. There are many methods in which bar graph can be built and this makes it a very often used chart type. Usually, a bar chart is created so that the bars are placed vertically. Such arrangement means that the bar's height value is proportional to the category value. Nevertheless, a bar chart can be also drawn horizontally. This means that the longer the bar, the bigger the category. Thus, a bar chart is a good way to present the relative values of different measured items. The ConceptDraw Bar Graphs solution allows you to draw a bar chart quickly using a vector library, containing the set of various bar charts objects.
 Basic Diagramming
This solution extends ConceptDraw PRO software with the specific tools you need to easily draw flowcharts, block diagrams, histograms, pie charts, divided bar diagrams, line graphs, circular arrows diagrams, Venn diagrams, bubble diagrams and concept maps
 Soccer
The Soccer (Football) Solution extends ConceptDraw PRO v9.5 (or later) software with samples, templates, and libraries of vector objects for drawing soccer (football) diagrams, plays schemas, and illustrations. It can be used to make professional looking
 Plant Layout Plans
This solution extends ConceptDraw PRO v.9.5 plant layout software (or later) with process plant layout and piping design samples, templates and libraries of vector stencils for drawing Plant Layout plans. Use it to develop plant layouts, power plant desig
HelpDesk
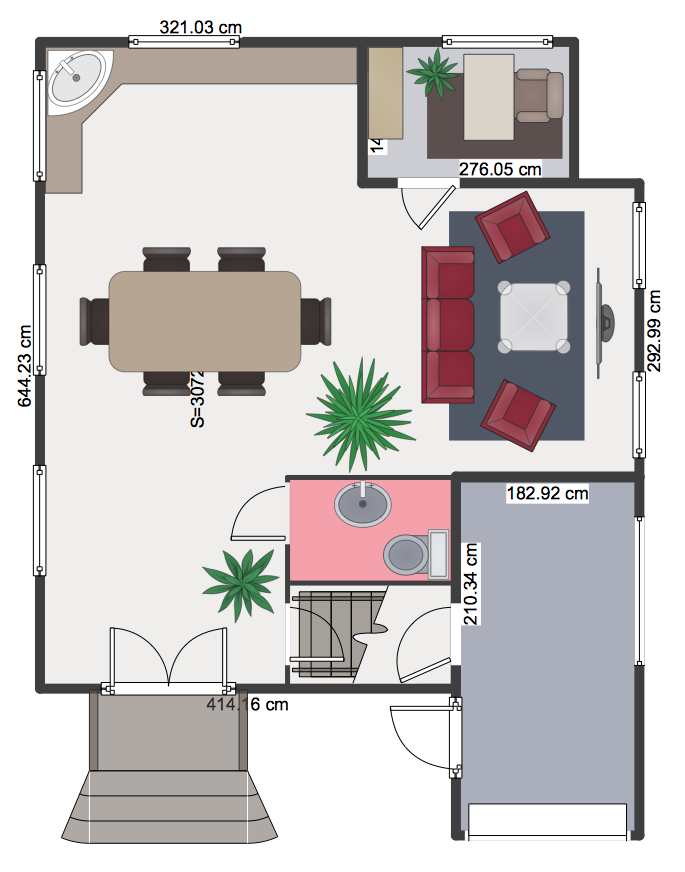
How to Create a Floor Plan Using ConceptDraw PRO
Making a floor plan is the best way to get a handle on how to organize your living space, and find out what could be changed. Creating a floor plan to scale is a challenge of the home and interior design process and can be noticeably helpful for visualizing things like furniture layout. You can use ConceptDraw PRO to produce layouts of real estate properties. ConceptDraw PRO contains the large quantity of pre-designed vector objects that you can use for quick and easy designing such floor plans. You can easily determine the size of the rooms and distances in you drawing. The ability to create a floor plan is delivered by the Floor Plans solution. This solution extends ConceptDraw PRO with libraries that contains over 500 objects of floor plan elements. There is a set of special objects that displays the sizes, corners, squares and other technical details using the current measurements of units.- Design elements - Vehicles 2D , 3D | Maps and Directions | 3D ...
- Directional Map Drawing Software
- 3D pictorial street map | Design elements - Vehicles 2D , 3D ...
- Map Directions | 2D Directional map - Template | Directional Maps ...
- 2d Drawing Software
- Design elements - Vehicles 2D , 3D | Diagram of a Pyramid | How To ...
- 2D Directional map - Template | Directional Maps | How To use ...
- 2D Directional map - Template | Directional Maps | Map Directions ...
- 2d Tractor Drawing
- 2D Directional map - Template | Directions Maps | Map Directions ...
- 2D Directional map - Template | Directions Maps | Directional Maps ...
- 2D Directional map - Template | Map Directions | Directions Map | 2d ...
- Directional Maps | How to Create a Directional Map Using ...
- Cafeteria 2d Plan Drawing
- 2d Road Diagram
- Hook up drawing - Home entertainment system with surround sound ...
- Parking Plan 2d
- Directional Maps | 2D Directional map - Template | Spatial ...
- 3D pictorial road map | 2D Directional map - Template | Maps | Road ...
- Truck 2d Drawing

