Column Chart Examples

Chart Maker for Presentations

Column Chart Template

Bar Chart

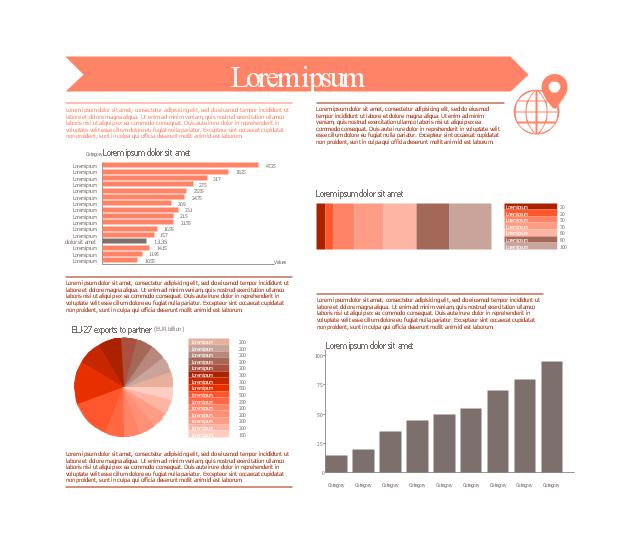
This marketing infographic template consists of design elements: title block, callout blocks, pictogram, horizontal bar graph, column chart, divided bar diagram, pie chart.
Use it to create your marketing infograms in the ConceptDraw PRO diagramming and vector drawing software.
The template "Marketing infogram 3" is included in the Marketing Infographics solution from the Business Infographics area of ConceptDraw Solution Park.
Use it to create your marketing infograms in the ConceptDraw PRO diagramming and vector drawing software.
The template "Marketing infogram 3" is included in the Marketing Infographics solution from the Business Infographics area of ConceptDraw Solution Park.
Marketing infogram template
Bar Chart Software

Bar Chart Template

Bar Charts

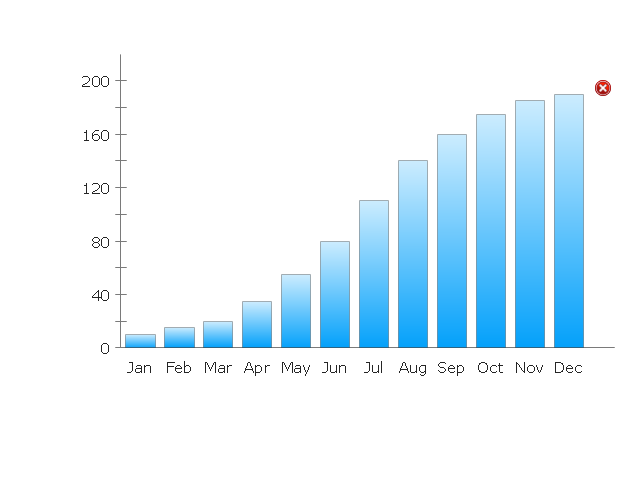
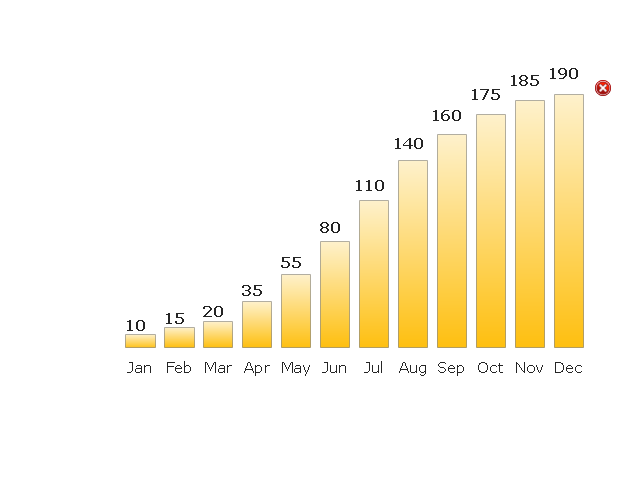
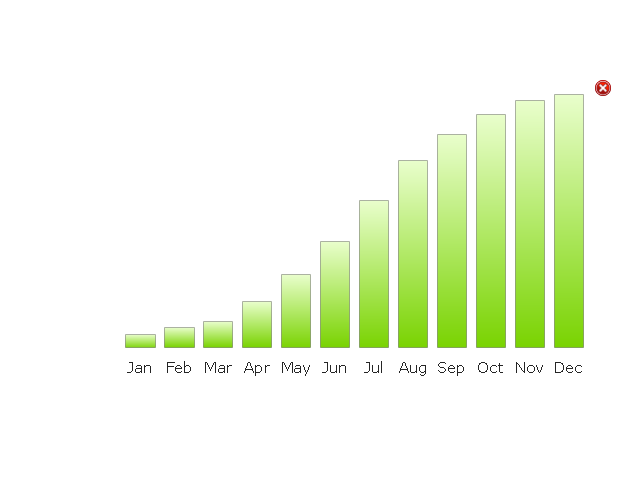
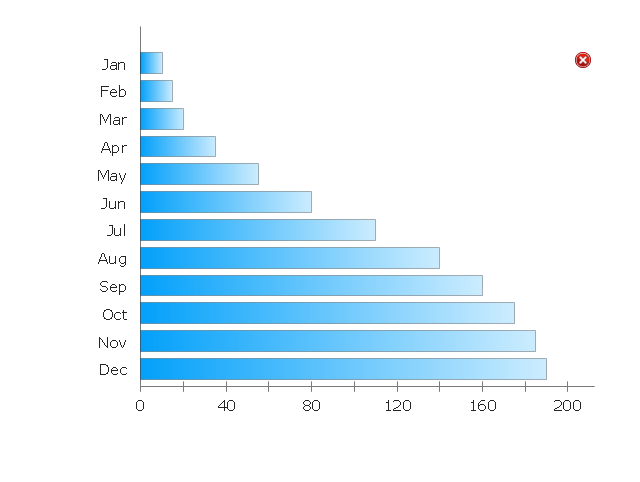
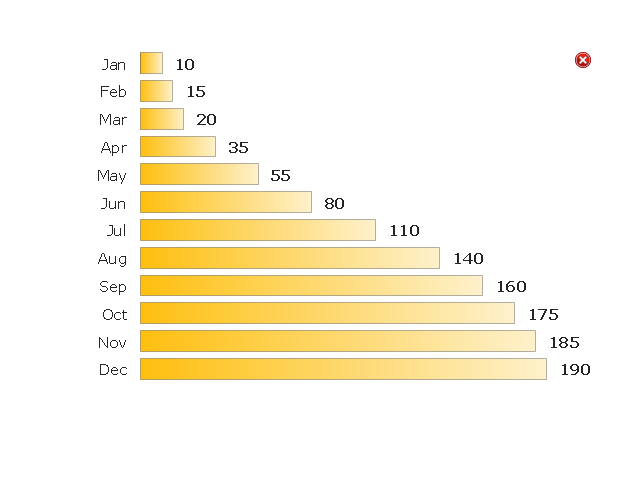
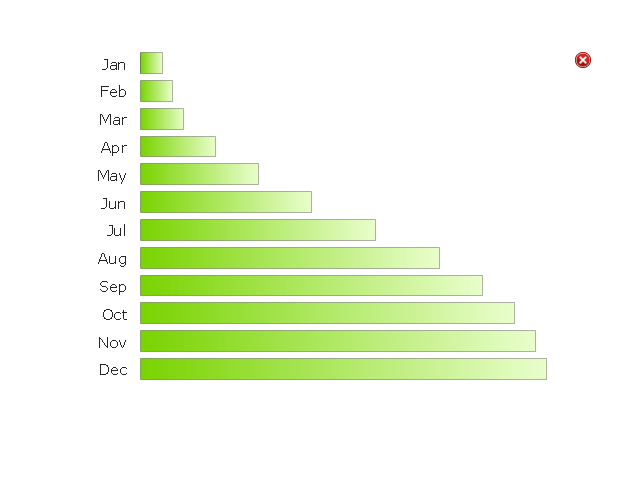
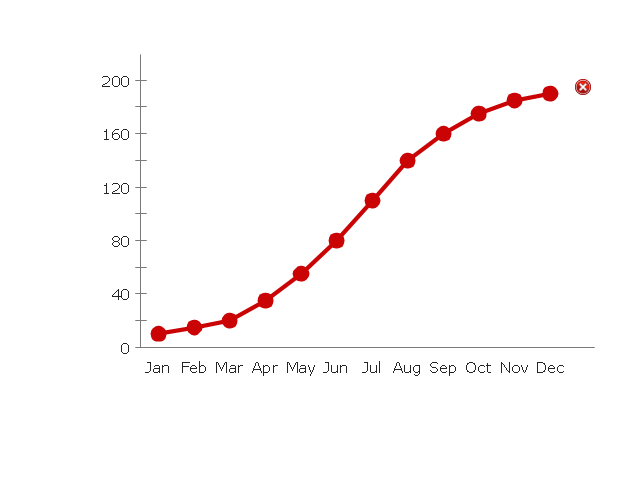
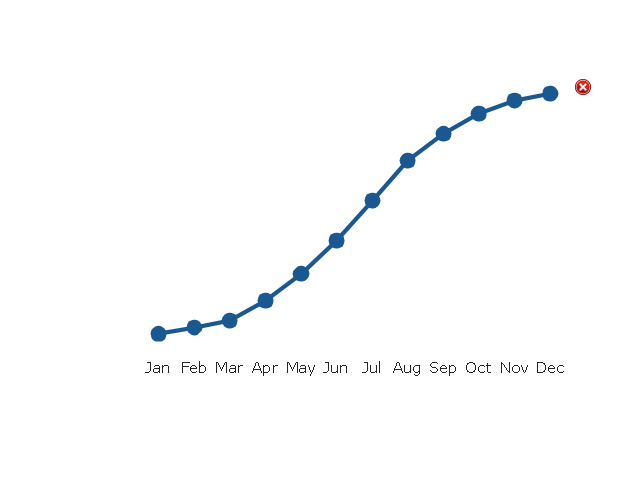
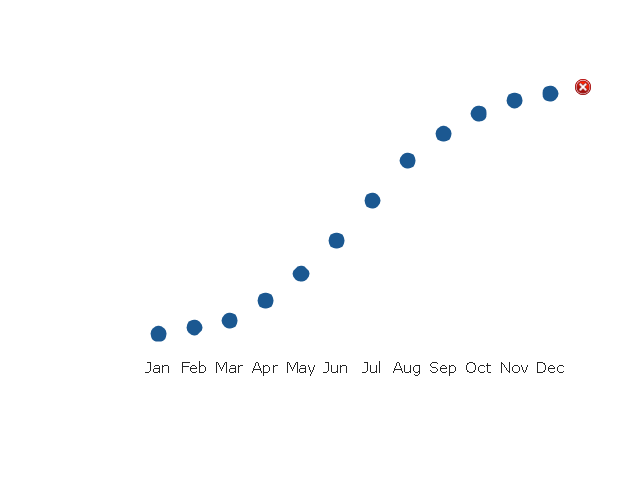
The vector stencils library "Time series charts" contains 10 templates of time series charts: 3 column charts, 3 bar charts, 2 line graphs and 2 dot plots. All these time series charts are Live Objects displaying the data from external data source files.
Use this library to create your visual dashboards in the ConceptDraw PRO diagramming and vector drawing software extended with the Time Series Dashboard solution from the area "What is a Dashboard" of ConceptDraw Solution Park.
Use this library to create your visual dashboards in the ConceptDraw PRO diagramming and vector drawing software extended with the Time Series Dashboard solution from the area "What is a Dashboard" of ConceptDraw Solution Park.
Column Chart 1
Column Chart 2
Column Chart 3
Bar Chart 1
Bar Chart 2
Bar Chart 3
Line Chart 1
Line Chart 2
Dot Plot 1
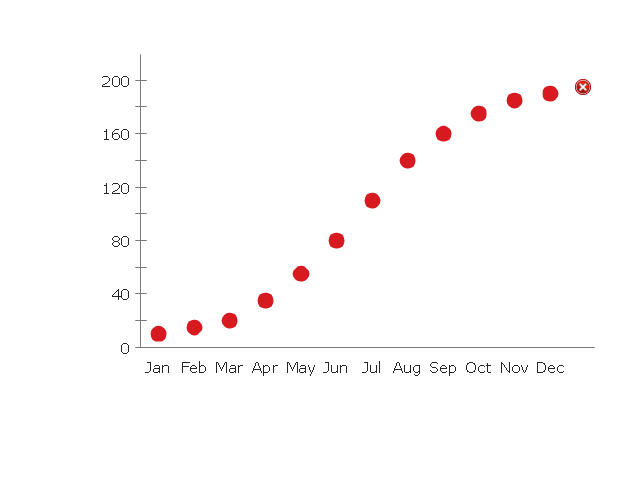
Dot Plot 2
Bar Chart Template for Word

- Bar Chart Template for Word | Column Chart Template | Chart Maker ...
- Line Chart | Line Chart Templates | Line Chart Examples | Time ...
- Column Chart Template | Column Chart Software | Chart Maker for ...
- Line Chart Templates | Design elements - Time series charts | Line ...
- Line Chart Template for Word | Line Graph Charting Software | Line ...
- 3 D Model On Double Bar Graph
- Time series charts
- Bar Chart Examples | Time series charts - Vector stencils library | Bar ...
- Double bar graph - Template | Bar Graph | Bar Chart Examples ...
- Design elements - Time series charts | How To Lines Disgns Draw ...