 Transport Hazard Pictograms
Transport Hazard Pictograms solution includes large variety of specially developed samples with transport hazard symbols and pictograms, and the whole set of predesigned vector transport GHS pictograms download and used with ease from the Transport Hazard Pictograms library. Apply them for quick designing professional-looking infographics and diagrams, use them to create warning signboards and announcements on all stages of the transportation process, to place them on the transport vehicles and warehouses of transportation companies, at the transport documentation and on the websites of transport and logistics companies.
 GHS Hazard Pictograms
GHS Hazard Pictograms solution contains the set of predesigned standard GHS pictograms, Hazardous symbols, and Hazard communication pictograms, approved and agreed by UN in Globally Harmonized System of Classification and Labelling of Chemicals (GHS). They can be used for quick and simple designing accurate and professional-looking infographics, diagrams, warning announcements, signboards, posters, precautionary declarations, regulatory documents, and for representing the main items of OSHA HAZCOM Standard.
Design Pictorial Infographics. Design Infographics
In the course of recent decades data visualization went through significant development and has become an indispensable tool of journalism, business intelligence and science. The way visual information may be conveyed is not limited simply to static or dynamic representation, it can also be interactive. Infographics can be conditionally divided into several general levels. Primarily, this is level of visualization of information, its interpretation and association on any ground. Second level can be defined as a visualization of knowledge, depiction of thoughts and ideas in the form of images or diagrams. Finally, the level of data visualization, which processes data arrays in charts, enabling the information to be more clearly perceived. You can also identify the main approaches to the creation of infographics: exploratory and narrative. Exploratory method insists on minimalist design in favor of data precision without unnecessary details and is common for scientific researches and anaInfographic Maker
Infographic is a visual way of representing various information, data, knowledge in statistics, geography, journalism, education, and much more areas. ConceptDraw PRO supplied with Pictorial Infographics Solution from the “What are Infographics” Area, provides a set of powerful pictorial infographics tools. Thanks to them it is the best Infographic Maker.
 Winter Sports
The Winter Sports solution from Sport area of ConceptDraw Solution Park contains winter sports illustration examples, templates and vector clipart libraries.
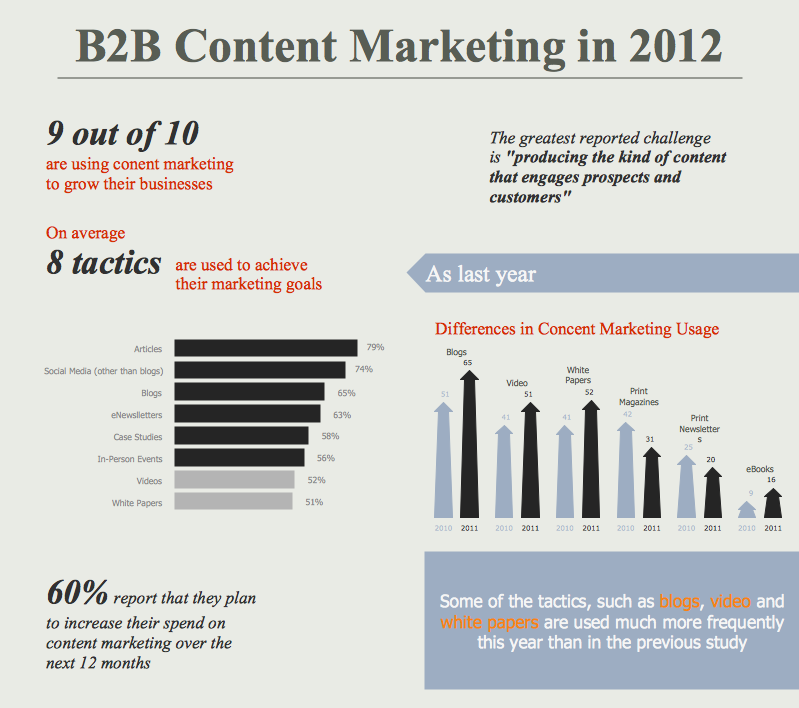
Content Marketing Infographics
The popularity of visual content marketing grows day by day. So now simple and convenient designing of professional looking Content Marketing Infographics becomes increasingly actual. For achievement this goal ConceptDraw PRO software offers the Marketing Infographics Solution from the Business Infographics Area.
 Soccer
The Soccer (Football) Solution extends ConceptDraw PRO v9.5 (or later) software with samples, templates, and libraries of vector objects for drawing soccer (football) diagrams, plays schemas, and illustrations. It can be used to make professional looking
Settlement Process Flowchart. Flowchart Examples
Create your own flow charts of settlement processes using the ConceptDraw PRO diagramming and vector drawing software extended with the Cross-Functional Flowcharts solution from the Business Processes area of ConceptDraw Solution Park. Download easy flowchart software to create settlement process flowcharts show steps of monthly settlement with your business quickly and easily.Marketing Plan Infographic
You need design the Marketing Plan Infographic and dream to find the useful tools to draw it easier, quickly and effectively? ConceptDraw PRO offers the unique Marketing Infographics Solution from the Business Infographics Area that will help you!- Calendars - Vector stencils library | Education pictograms - Vector ...
- Time and clock pictograms - Vector stencils library | Time - Vector ...
- Time and clock pictograms - Vector stencils library | Design ...
- Time and clock pictograms - Vector stencils library | How to ...
- Time and clock pictograms - Vector stencils library | Time and clock ...
- Office pictograms - Vector stencils library | Entity Relationship ...
- Time - Design Elements | Time and clock pictograms - Vector ...
- How to Customize a Task's Duration | Time and clock pictograms ...
- Basketball Court Dimensions | Time and clock pictograms - Vector ...
- Travel and tourism pictograms
- Medicine and health pictograms - Vector stencils library | Medicine ...
- Design Pictorial Infographics. Design Infographics | Time and clock ...
- Basketball courts - Vector stencils library | Time and clock ...
- Pyramid Diagram | Time - Vector stencils library | Time and clock ...
- Design elements - Shopping pictograms | Landmarks - Vector ...
- Design elements - People | Design elements - Marketing pictograms ...
- Time - Design Elements | Road signs - Vector stencils library | Time ...
- Ecology pictograms - Vector stencils library | Design elements ...
- Strategy Clock Template | iPhone OS (iOS) graphic user interface ...
- Design elements - Transport pictograms | Design Pictorial ...


