ERD Symbols and Meanings
Entity Relationship Diagram (ERD) is a popular software engineering tool for database modeling and illustration the logical structure of databases, which uses one of two notations - Chen's or Crow’s Foot. Crow's foot notation is effective when used in software engineering, information engineering, structured systems analysis and design. Each of these notations applies its own set of ERD symbols. Crow's foot diagrams use boxes to represent entities and lines between these boxes to show relationships. Varied shapes at the ends of lines depict the cardinality of a given relationship. Chen's ERD notation is more detailed way to represent entities and relationships. ConceptDraw DIAGRAM application enhanced with all-inclusive Entity-Relationship Diagram (ERD) solution allows design professional ER diagrams with Chen's or Crow’s Foot notation on your choice. It contains the full set of ready-to-use standardized ERD symbols and meanings helpful for quickly drawing, collection of predesigned ERD samples, examples and templates. ConceptDraw Pro is a great alternative to Visio for Mac users as it offers more features and can easily handle the most demanding professional needs.
Venn Diagram Examples for Problem Solving. Venn Diagram as a Truth Table
Venn diagrams are illustrations used in the branch of mathematics known as set theory. They show the mathematical or logical relationship between different groups of things (sets). A Venn diagram shows all the possible logical relations between the sets.Venn Diagram Examples for Problem Solving. Computer Science. Chomsky Hierarchy
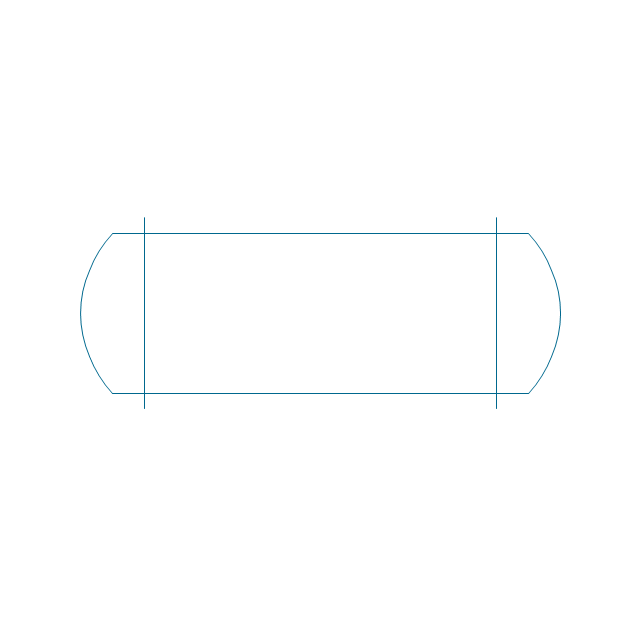
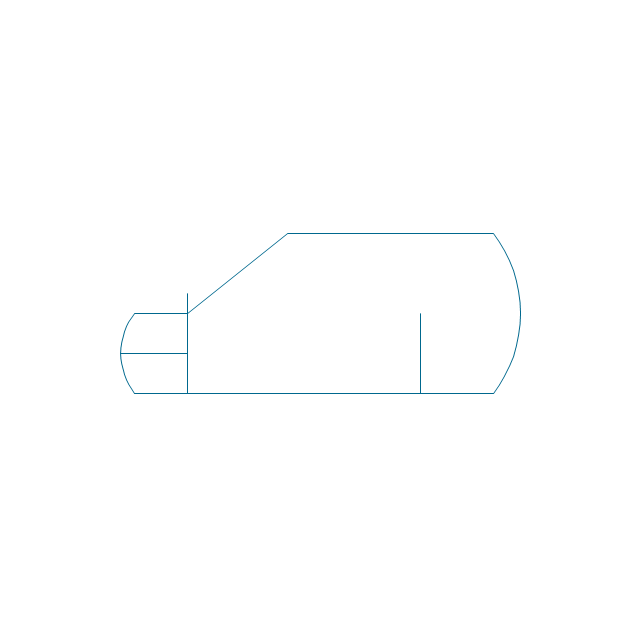
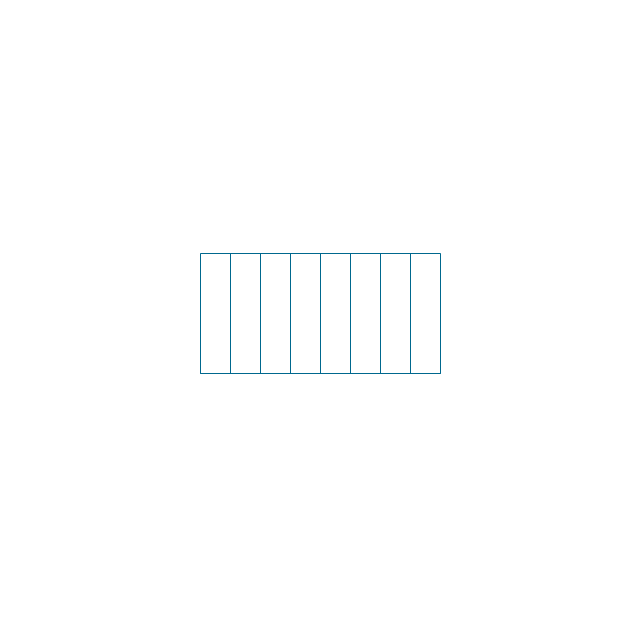
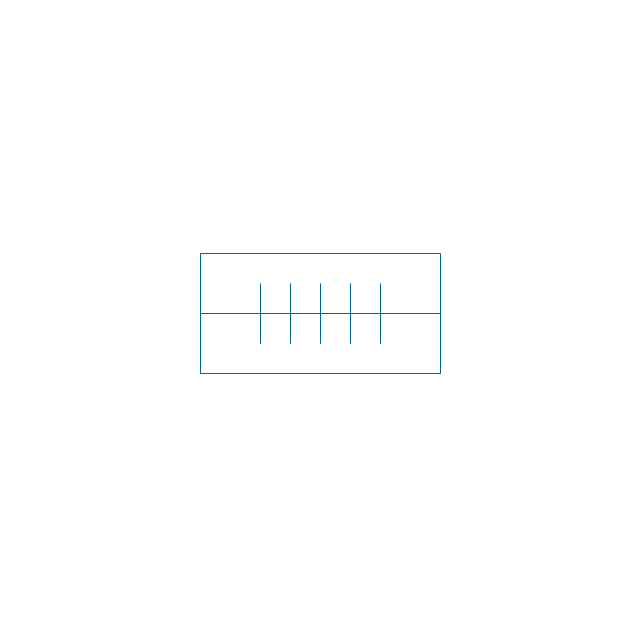
A Venn diagram, sometimes referred to as a set diagram, is a diagramming style used to show all the possible logical relations between a finite amount of sets. In mathematical terms, a set is a collection of distinct objects gathered together into a group, which can then itself be termed as a single object. Venn diagrams represent these objects on a page as circles or ellipses, and their placement in relation to each other describes the relationships between them. The Venn diagram example below visualizes the the class of language inclusions described by the Chomsky hierarchy.The vector stencils library "Heating equipment" contains 42 symbols of regenerators, intercoolers, heaters, and condensers.
Use these shapes for drawing cooling systems, heat recovery systems, thermal, heat transfer and mechanical design, and process flow diagrams (PFD) in the ConceptDraw PRO software extended with the Chemical and Process Engineering solution from the Chemical and Process Engineering area of ConceptDraw Solution Park.
www.conceptdraw.com/ solution-park/ engineering-chemical-process
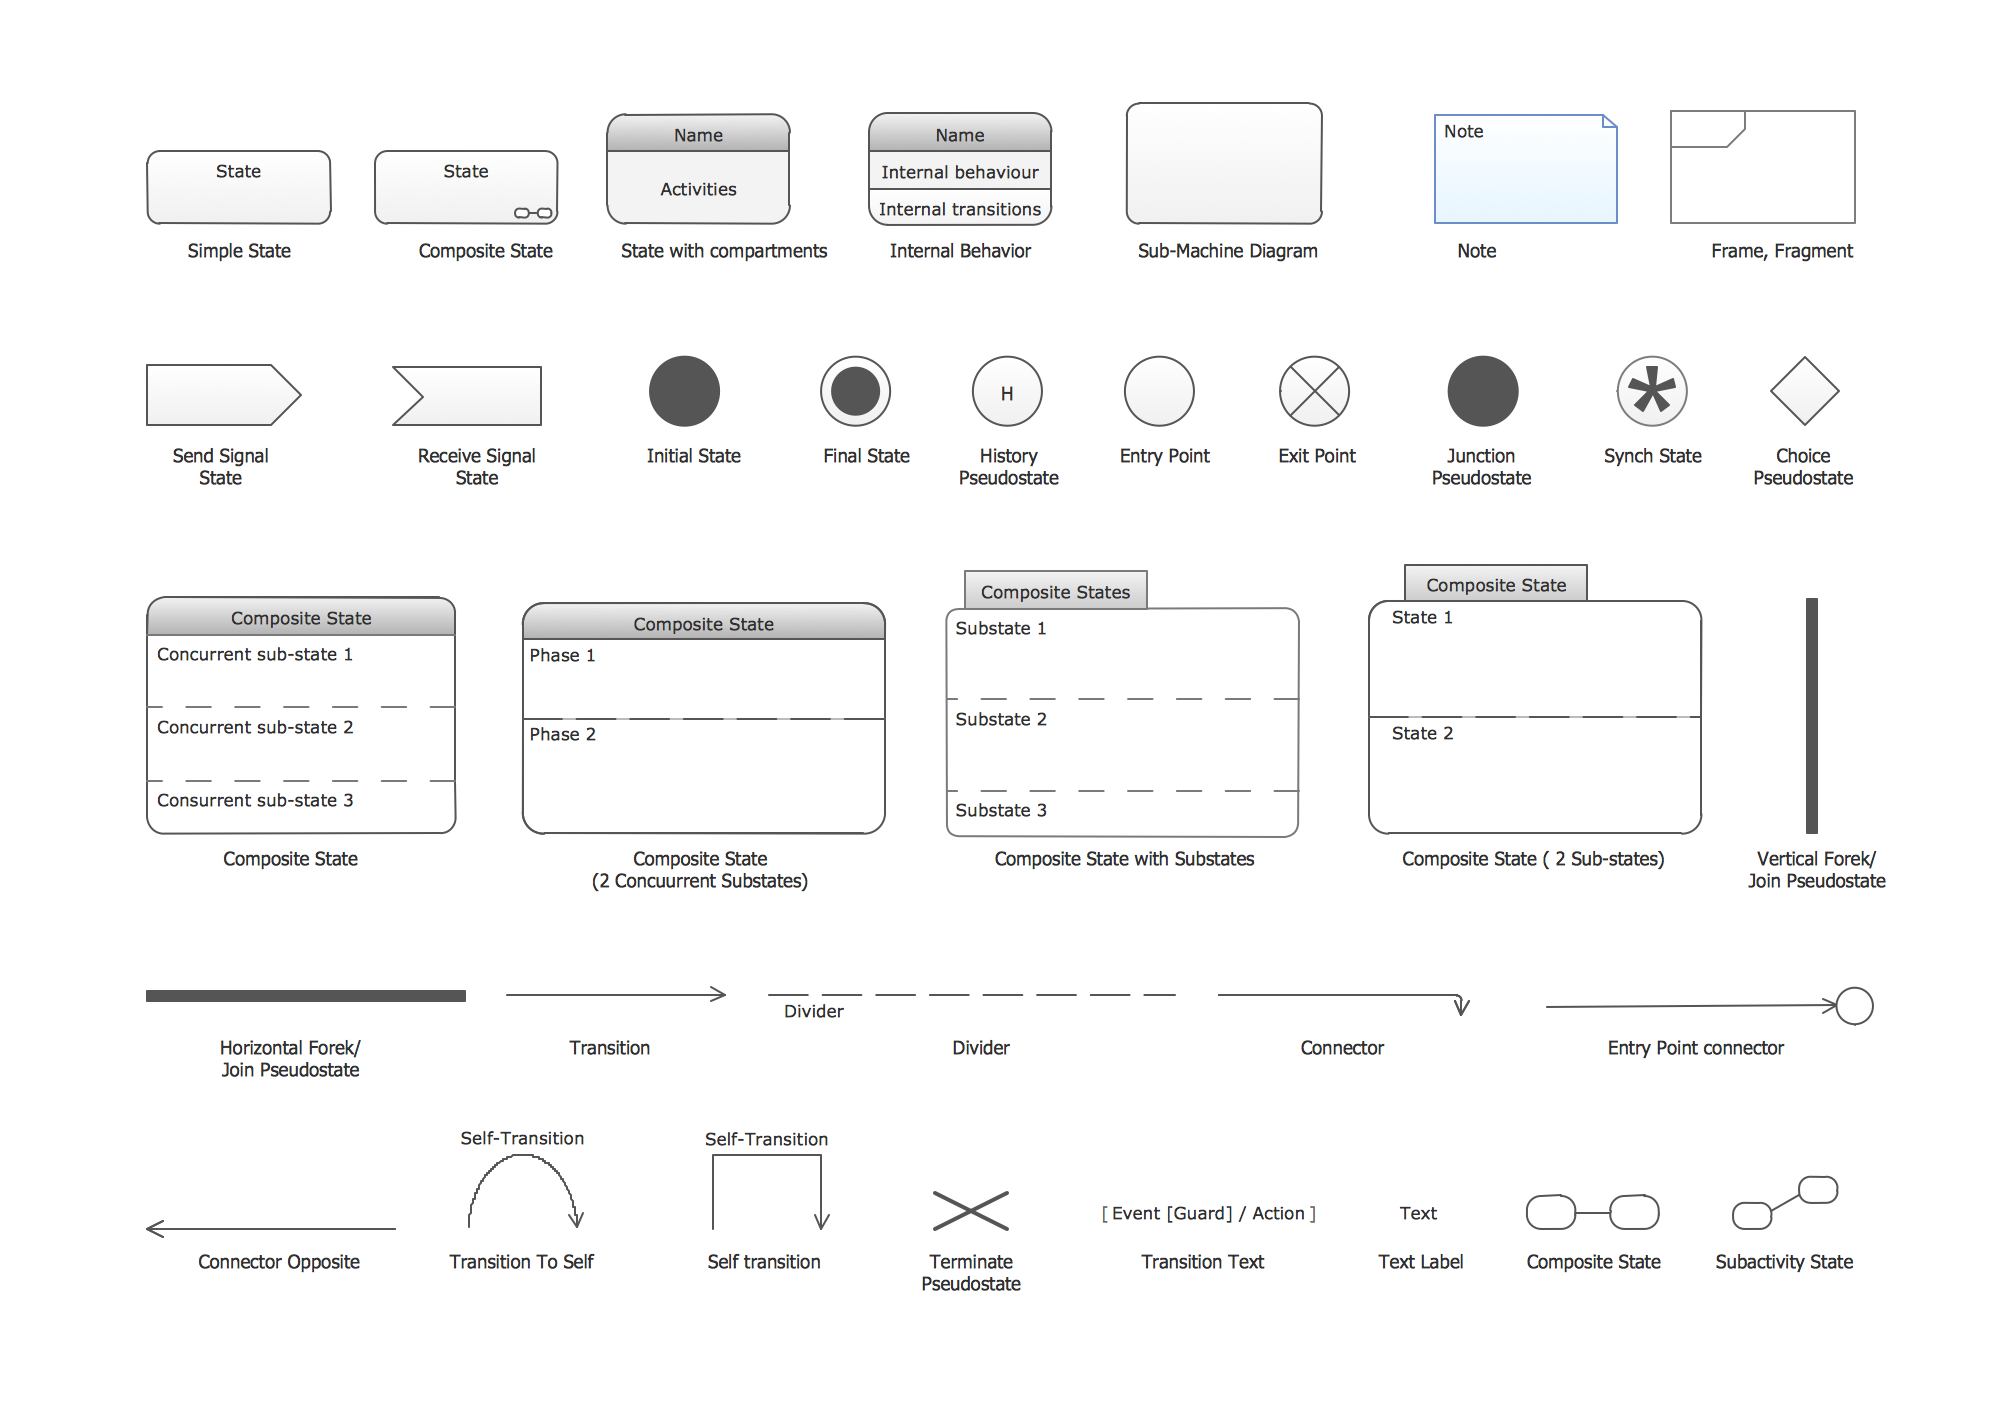
UML State Machine Diagram.Design Elements
UML state machine's goal is to overcome the main limitations of traditional finite-state machines while retaining their main benefits. ConceptDraw has 393 vector stencils in the 13 libraries that helps you to start using software for designing your own UML Diagrams. You can use the appropriate stencils of UML notation from UML State Machine library.
 Business Diagrams
The Business Diagrams Solution extends ConceptDraw DIAGRAM with an extensive collection of professionally designed illustrative samples and a wide variety of vector stencils libraries, which are the real help for all business-related people, business analysts, business managers, business advisers, marketing experts, PR managers, knowledge workers, scientists, and other stakeholders allowing them to design the bright, neat, expressive and attractive Bubble Diagrams, Circle-Spoke Diagrams, Circular Arrows Diagrams, and Venn Diagrams with different quantity of sets in just minutes; and then successfully use them in documents, reports, statistical summaries, and presentations of any style.
UML Class Diagram Constructor
UML Class Diagrams is a type of static structure diagram that is used both for general conceptual modeling of the systematics of the application, and for detailed modeling translating the models into programming code. It describes the structure of a system by showing the: classes of a system, attributes, operations, and the relationships between them. The Rapid UML Solution for ConceptDraw DIAGRAM includes the UML Class Diagram library that helps you to design the UML Class Diagram quick and easy. You can simply and quickly drop the ready-to-use objects from the library into your document to create the UML Class Diagram.Venn Diagram Examples for Problem Solving. Computer Science. Chomsky Hierarchy
A Venn diagram, sometimes referred to as a set diagram, is a diagramming style used to show all the possible logical relations between a finite amount of sets. In mathematical terms, a set is a collection of distinct objects gathered together into a group, which can then itself be termed as a single object. Venn diagrams represent these objects on a page as circles or ellipses, and their placement in relation to each other describes the relationships between them. The Venn diagram example below visualizes the the class of language inclusions described by the Chomsky hierarchy.Venn Diagram Examples for Problem Solving
Venn diagrams are illustrations used in the branch of mathematics known as set theory. They show the mathematical or logical relationship between different groups of things (sets). A Venn diagram shows all the possible logical relations between the sets.
 Timeline Diagrams
Timeline Diagrams solution extends ConceptDraw DIAGRAM diagramming software with samples, templates and libraries of specially developed smart vector design elements of timeline bars, time intervals, milestones, events, today marker, legend, and many other elements with custom properties, helpful for professional drawing clear and intuitive Timeline Diagrams. Use it to design simple Timeline Diagrams and designate only the main project stages, or highly detailed Timeline Diagrams depicting all project tasks, subtasks, milestones, deadlines, responsible persons and other description information, ideal for applying in presentations, reports, education materials, and other documentation.
- 3 Overlapping Circles
- Process Flow Diagram Symbols | Mechanical Drawing Symbols ...
- 3 Circle Venn. Venn Diagram Example | 4-Set Venn diagram ...
- 3 Circle Venn. Venn Diagram Example | Basic Circles Venn ...
- Mathematical Diagrams | Mathematics Symbols | Basic Flowchart ...
- Process Flow Diagram Symbols | Design elements - Heating ...
- Intercooler Symbols
- 3 Circle Venn Diagram. Venn Diagram Example
- 3 Circle Venn Diagram Vector
- Venn Diagram Template | Venn Diagram Template for Word | 3 ...














-heating-equipment---vector-stencils-library.png--diagram-flowchart-example.png)



-heating-equipment---vector-stencils-library.png--diagram-flowchart-example.png)
-heating-equipment---vector-stencils-library.png--diagram-flowchart-example.png)
-heating-equipment---vector-stencils-library.png--diagram-flowchart-example.png)
-heating-equipment---vector-stencils-library.png--diagram-flowchart-example.png)
-heating-equipment---vector-stencils-library.png--diagram-flowchart-example.png)
-heating-equipment---vector-stencils-library.png--diagram-flowchart-example.png)
-heating-equipment---vector-stencils-library.png--diagram-flowchart-example.png)
-heating-equipment---vector-stencils-library.png--diagram-flowchart-example.png)


-heating-equipment---vector-stencils-library.png--diagram-flowchart-example.png)


