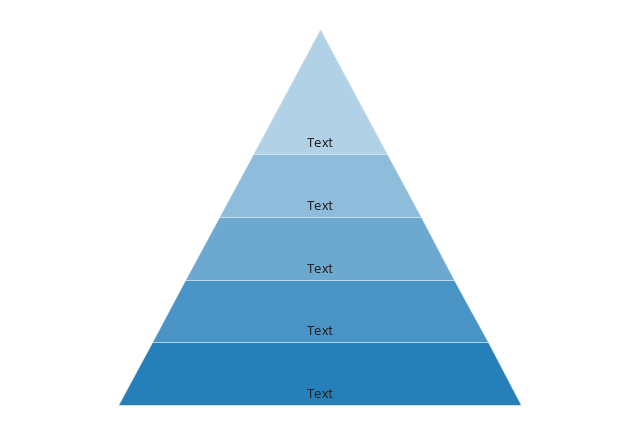
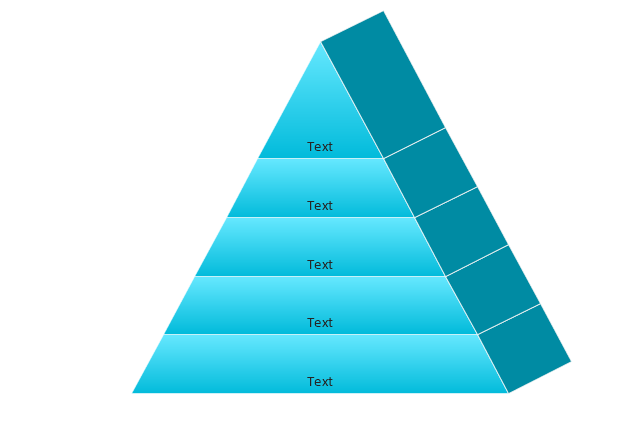
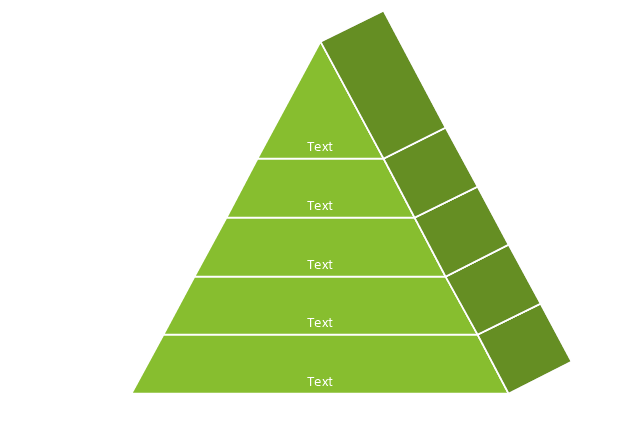
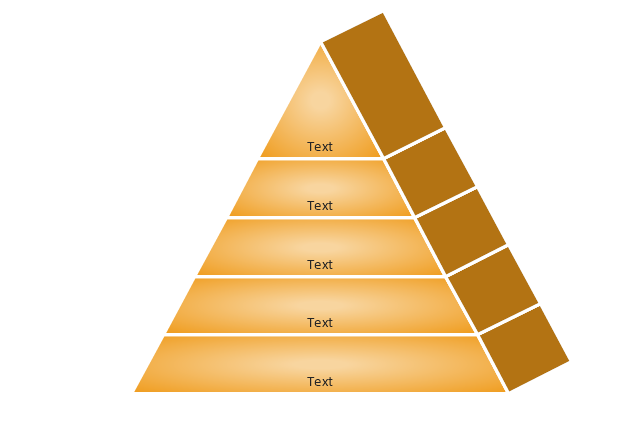
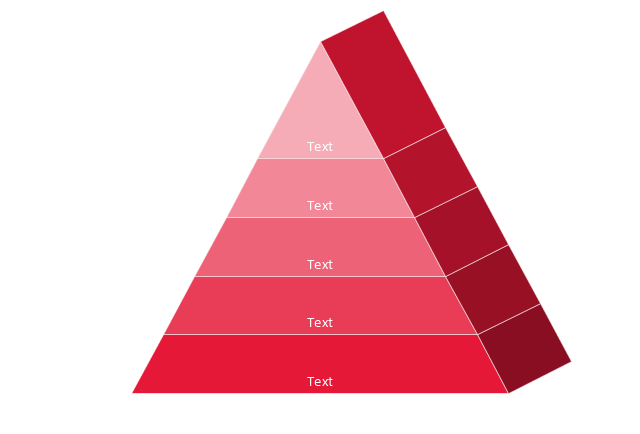
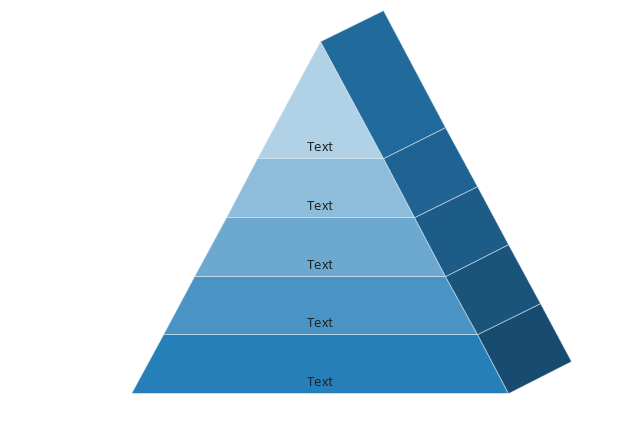
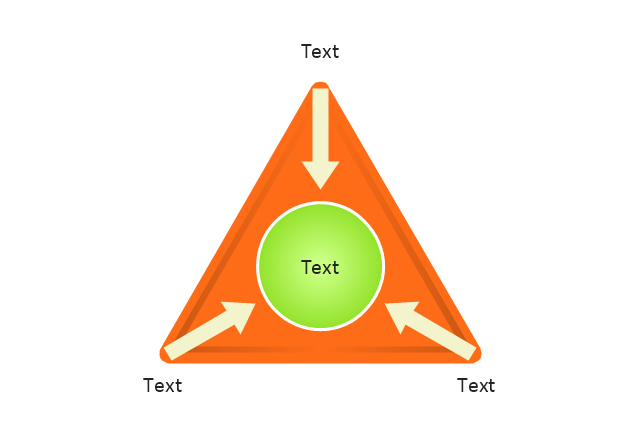
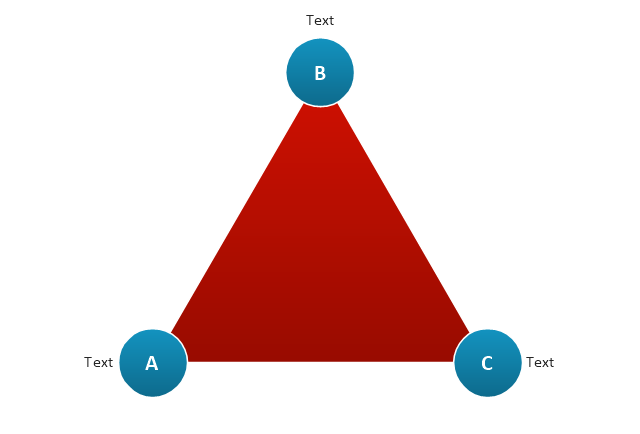
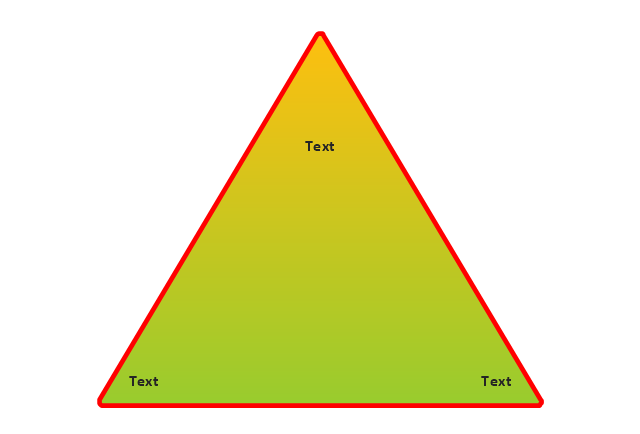
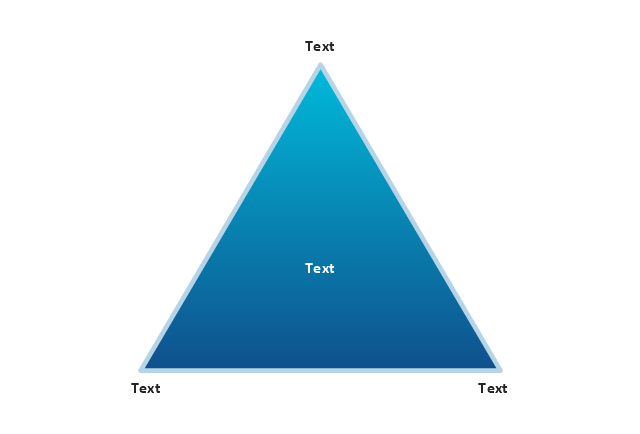
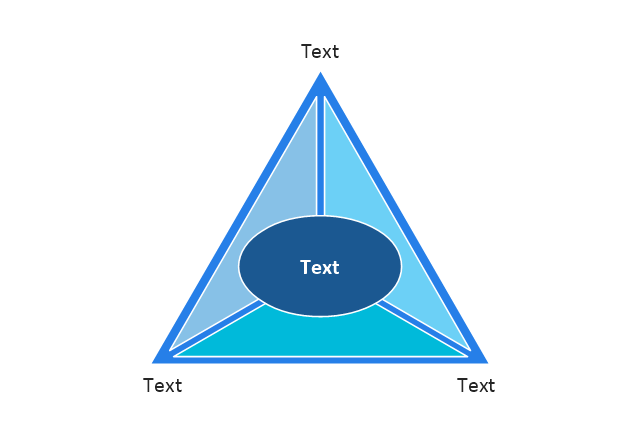
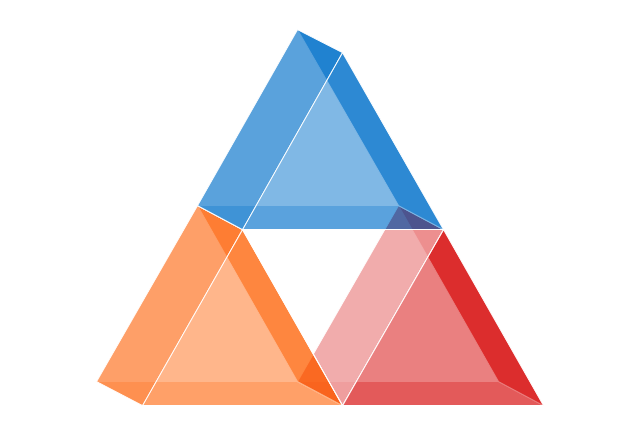
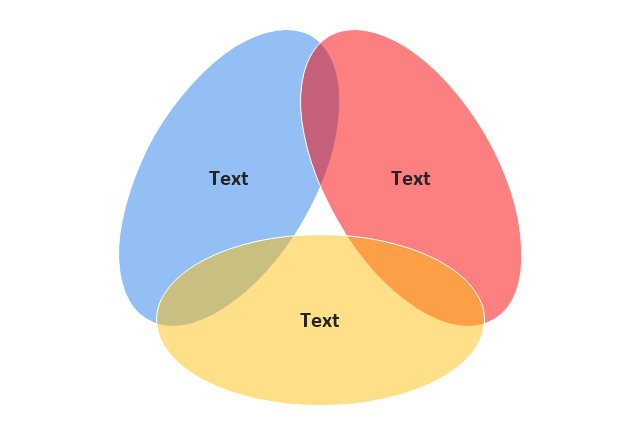
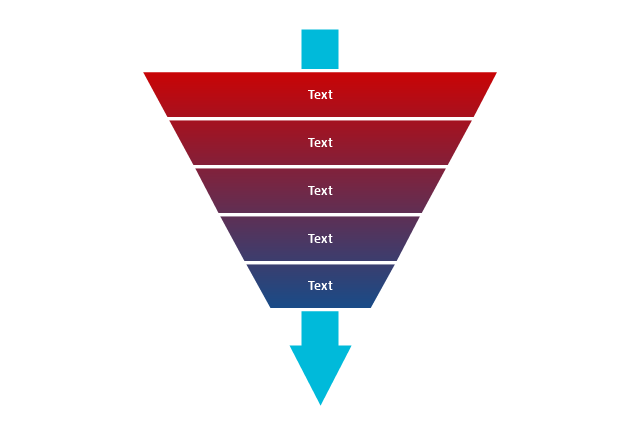
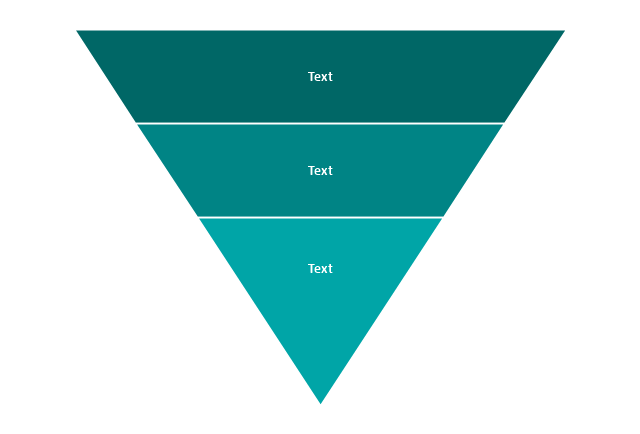
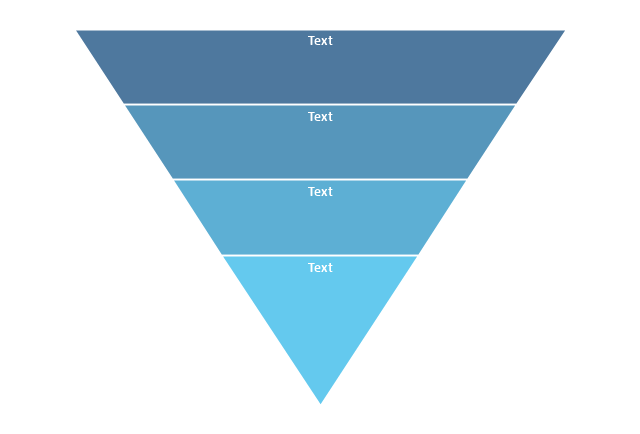
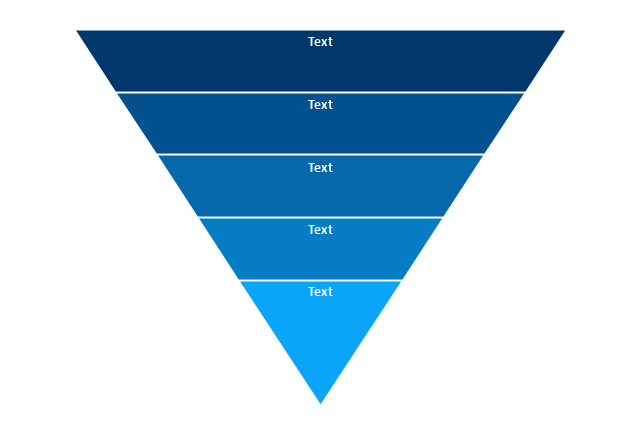
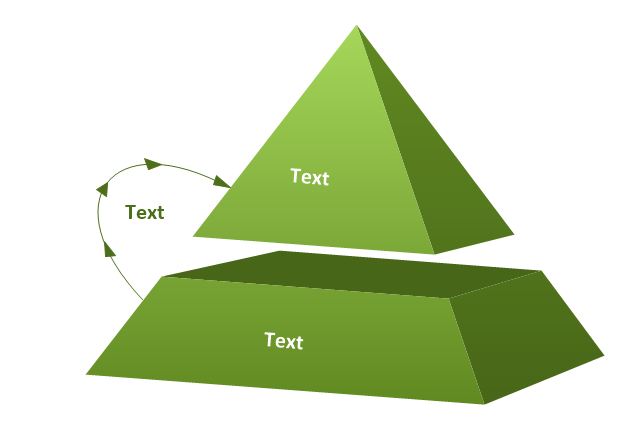
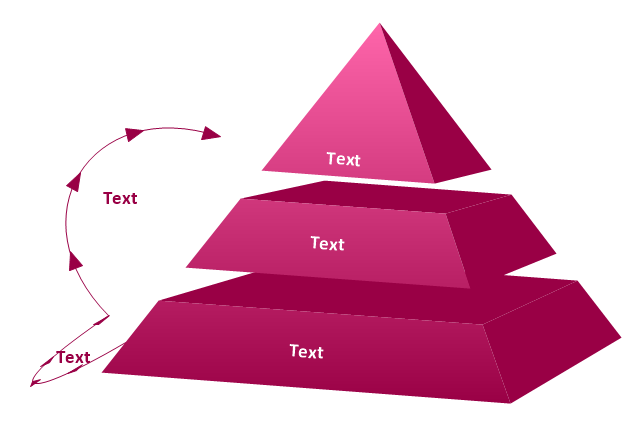
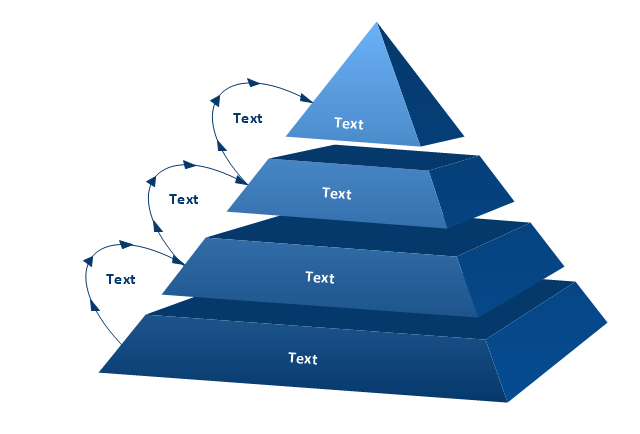
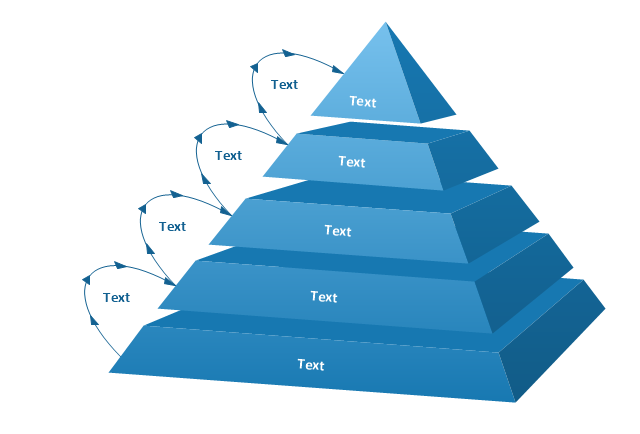
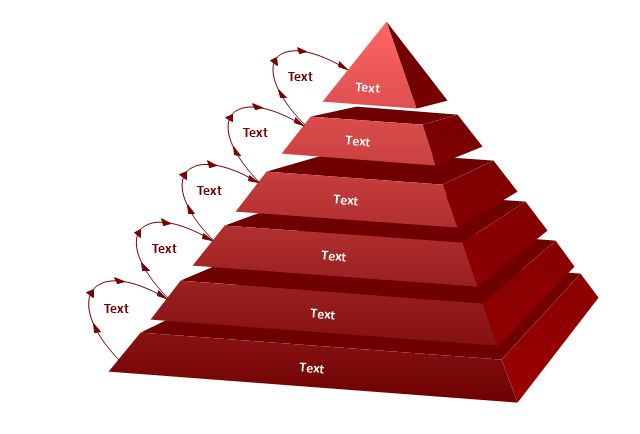
The vector stencils library "Pyramid diagrams" contains 28 templates of pyramid diagrams, triangle charts and triangular schemes.
Use these templates to create your pyramid diagrams in the ConceptDraw PRO diagramming and vector drawing software extended with the Pyramid Diagrams solution from the Marketing area of ConceptDraw Solution Park.
Use these templates to create your pyramid diagrams in the ConceptDraw PRO diagramming and vector drawing software extended with the Pyramid Diagrams solution from the Marketing area of ConceptDraw Solution Park.
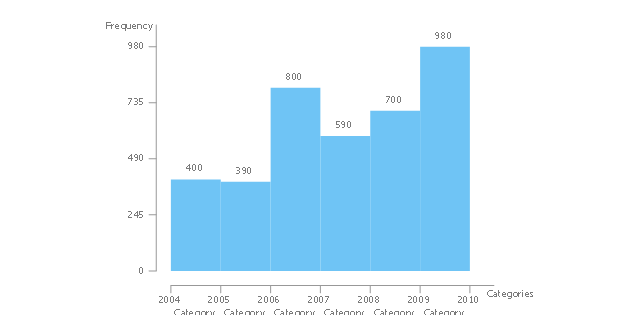
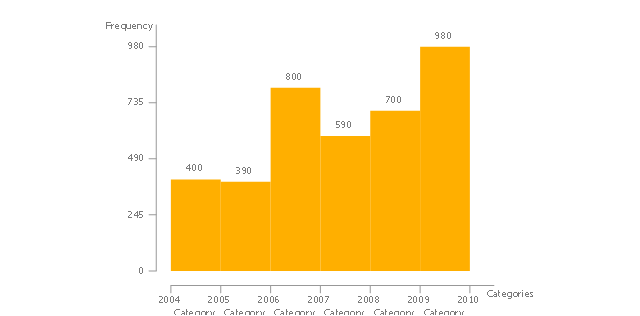
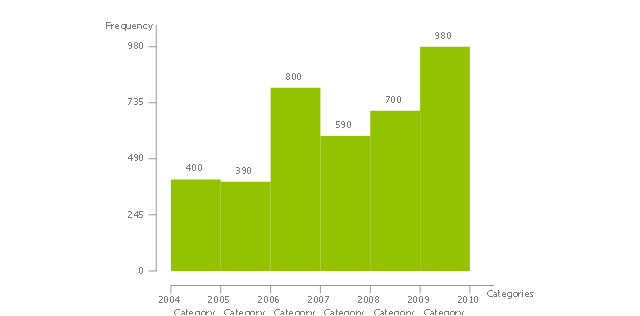
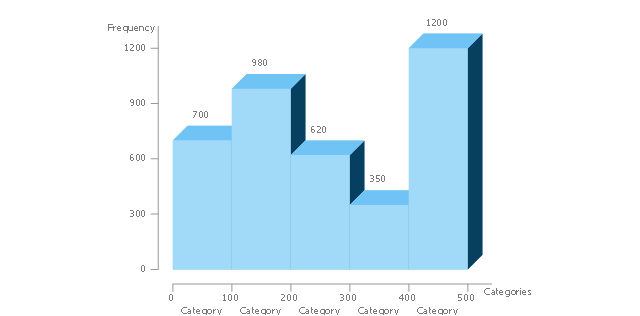
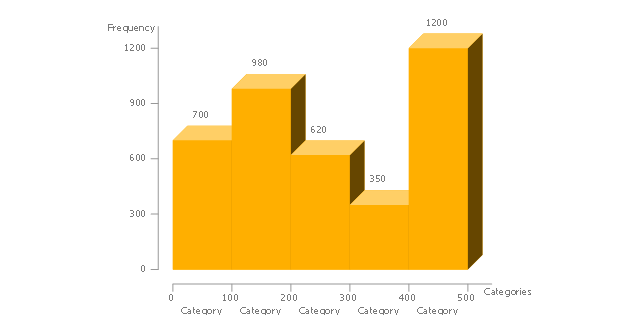
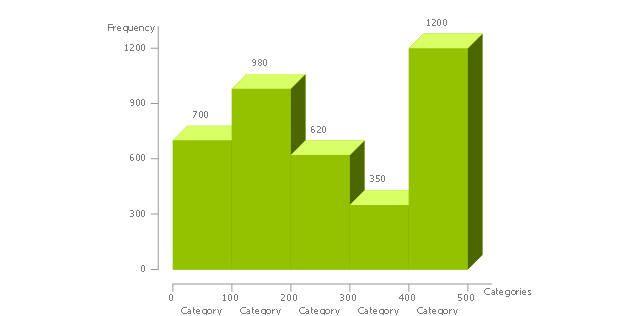
The vector stencils library "Histograms" contains 8 templates of histograms for visualizing frequency distribution data.
Drag a template from the library to your document and enter your data.
Use these shapes to draw your histograms in ConceptDraw PRO diagramming and vector drawing software.
The vector stencils library "Histograms" is included in the Histograms solution from the Graphs and Charts area of ConceptDraw Solution Park.
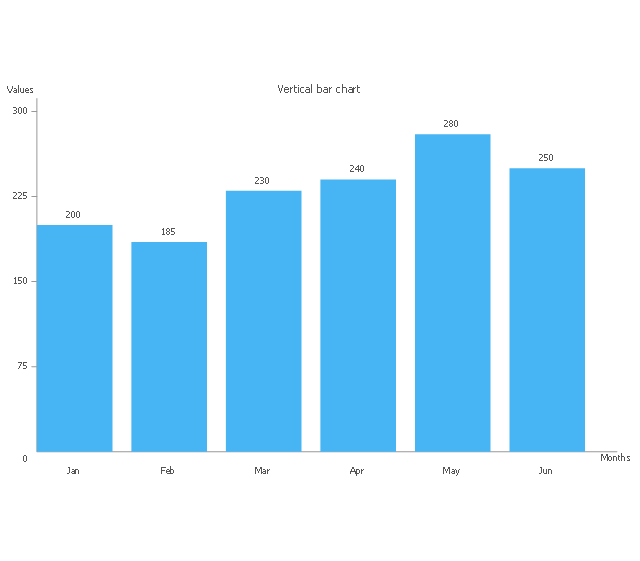
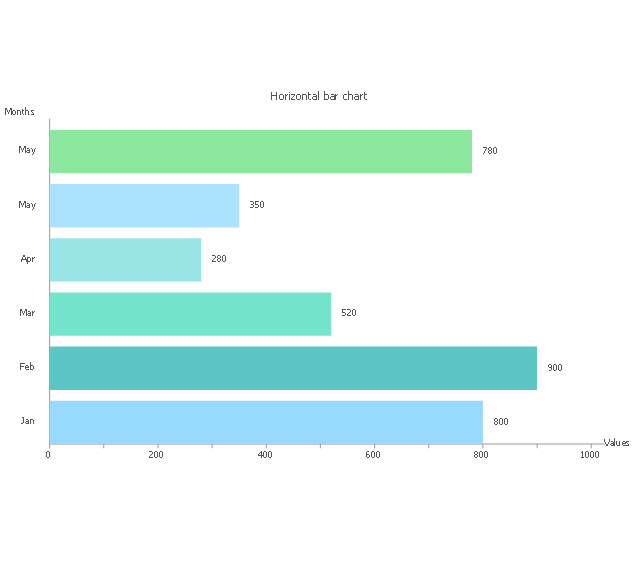
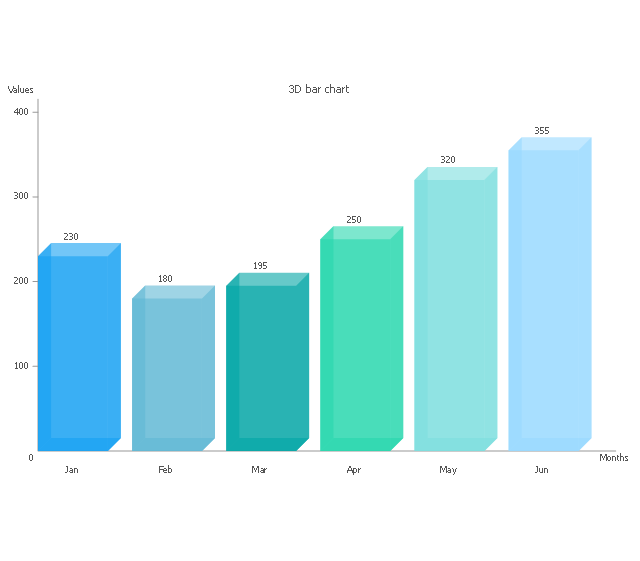
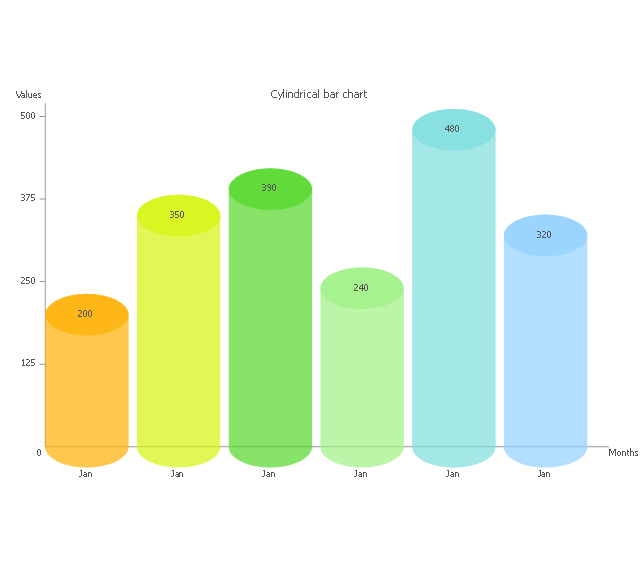
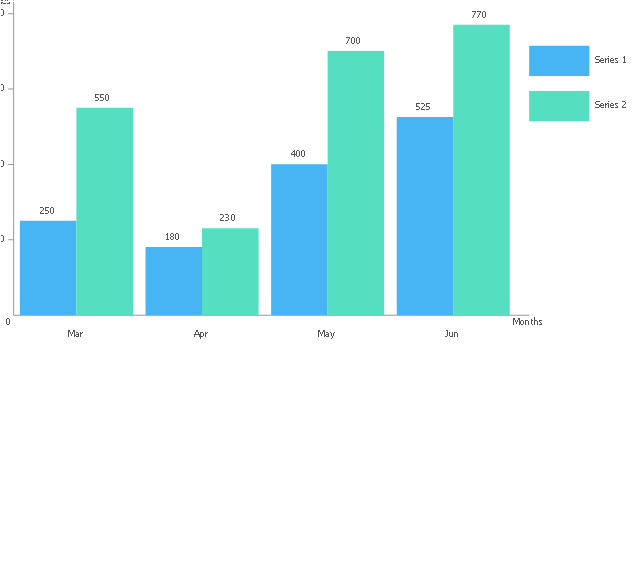
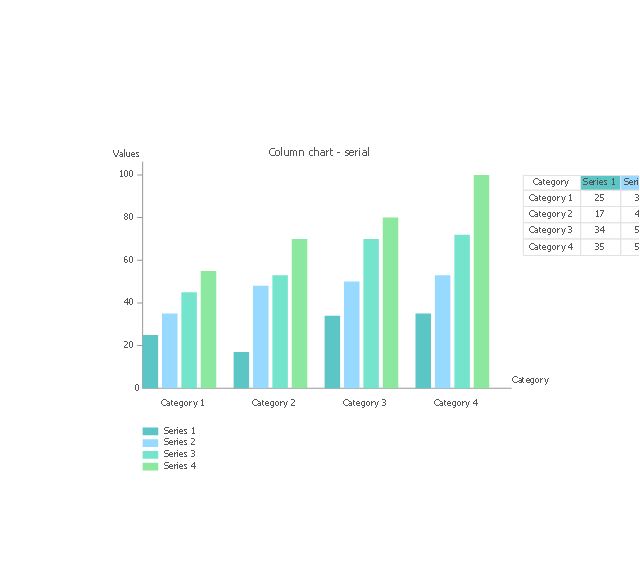
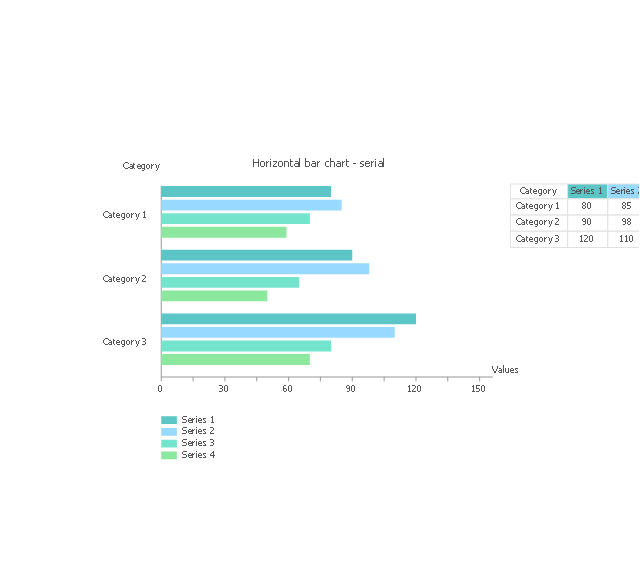
The vector stencils library "Bar charts" contains 7 templates of bar and column charts for visualizing quantitative and statistical data comparison and changes in time series. Drag template from library to your document and enter your data.
Use these shapes to draw your bar graphs in the ConceptDraw PRO diagramming and vector drawing software.
The vector stencils library "Bar charts" is included in the Bar Graphs solution from the Graphs and Charts area of ConceptDraw Solution Park.
Use these shapes to draw your bar graphs in the ConceptDraw PRO diagramming and vector drawing software.
The vector stencils library "Bar charts" is included in the Bar Graphs solution from the Graphs and Charts area of ConceptDraw Solution Park.
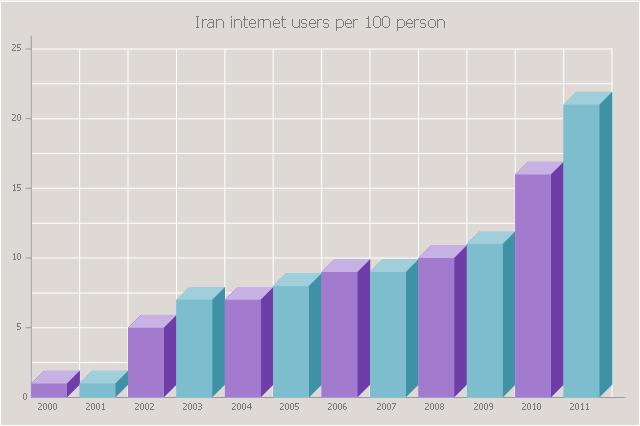
The 3D vertical bar graph sample shows the Iran internet users per 100 person from 2000 to 2011. It was designed on the base of the Commons Wikimedia file: Iran internet users per 100 person.png.
[commons.wikimedia.org/ wiki/ File:Iran_ internet_ users_ per_ 100_ person.png]
This file is licensed under the Creative Commons Attribution-Share Alike 3.0 Unported license. [creativecommons.org/ licenses/ by-sa/ 3.0/ deed.en]
The data source is World Bank: [data.worldbank.org/ country/ iran-islamic-republic]
"In 1993 Iran became the second country in the Middle East to be connected to the Internet, and since then the government has made significant efforts to improve the nation's ICT infrastructure. Iran's national Internet connectivity infrastructure is based on two major networks: the public switched telephone network (PSTN) and the public data network. The PSTN provides a connection for end-users to Internet service providers (ISPs) over mostly digital lines and supports modem-based connections. The Data Communication Company of Iran (DCI), a subsidiary of TCI, operates the public data network." [Internet in Iran. Wikipedia]
The 3D column chart example "Iran internet users per 100 person" was created using the ConceptDraw PRO diagramming and vector drawing software extended with the Bar Graphs solution from the Graphs and Charts area of ConceptDraw Solution Park.
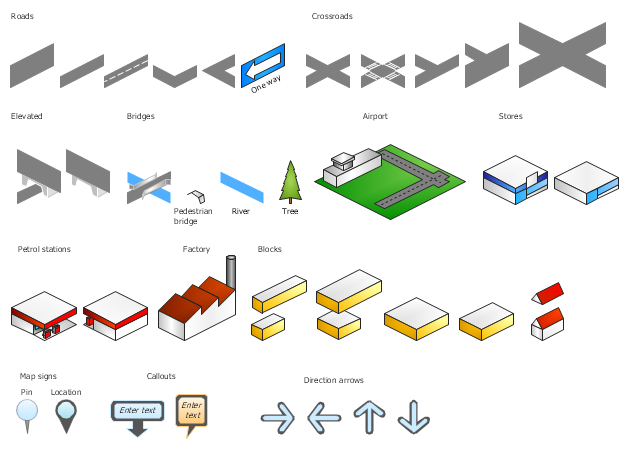
The vector stencils library "3D directional maps" contains 40 symbols for creating pictorial maps, street maps, locator maps, transit maps, tourist maps with points of interest (POI), road maps and route maps using the ConceptDraw PRO diagramming and vector drawing software.
"Pictorial maps are a category of maps that are also loosely called illustrated maps, panoramic maps, perspective maps, bird’s-eye view maps and Geopictorial maps amongst others. In contrast to the regular road map, Atlas or topographic cartography, pictorial maps depict a given territory with a more artistic rather than technical style. The cartography can be a sophisticated 3-D perspective landscape or a simple map graphic enlivened with illustrations of buildings, people and animals. They can feature all sorts of varied topics like historical events, legendary figures or local agricultural products and cover anything from an entire continent to a college campus. ...
Pictorial maps usually show an area as if viewed from above at an oblique angle. They are not generally drawn to scale in order to show street patterns, individual buildings, and major landscape features in perspective. While regular maps focus on the accurate rendition of distances, pictorial maps enhance landmarks and often incorporate a complex interplay of different scales into one image in order to give the viewer a more familiar sense of recognition." [Pictorial maps. Wikipedia]
The design elements library "3D directional maps" is included in the Directional Maps solution from the Maps area of ConceptDraw Solution Park.
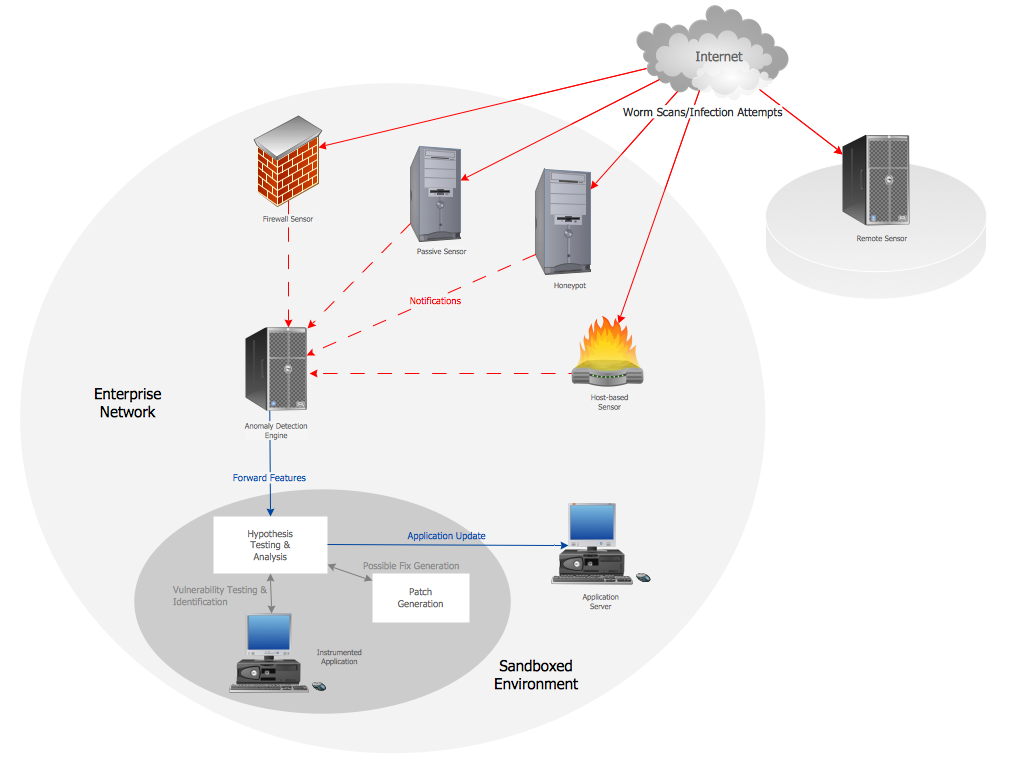
Computer Network Architecture. Computer and Network Examples
The network architecture and design specialization will help you gain the technical leadership skills you need to design and implement high-quality networks that support business needs.
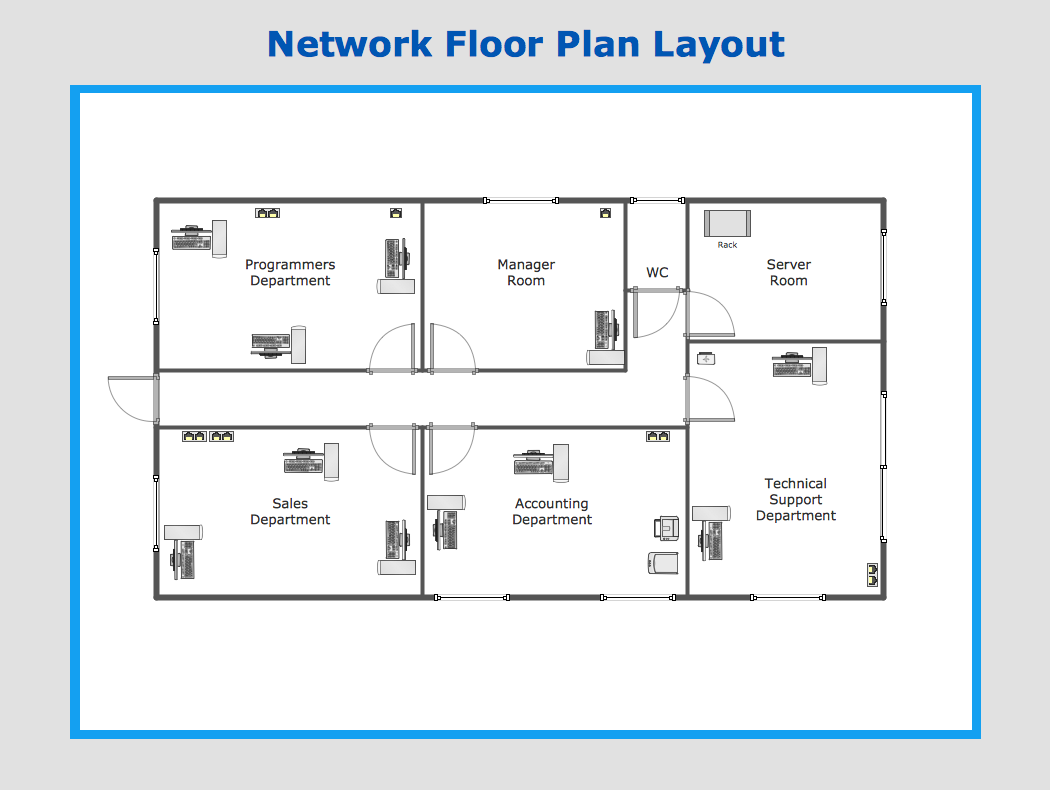
Network Layout
The Network Layout Diagram visually illustrates the arrangement of computers, nodes and other network appliances, such as servers, printers, routers, switches, hubs, and their relationships between each other. The network layout and placement of servers greatly influence on the network security and network performance. Elaboration of robust Network Layout Diagram is especially important when visualizing already existing network in order to understand its complexity; when troubleshooting the network issues; designing, documenting and implementing new network configurations; extending, modifying, or moving an existing network to other location. Through the careful thinking the network plan and designing the clear Network Layout Diagram, you can be confident in result on the stage of network implementation and to solve faster the problems appearing in network infrastructure. ConceptDraw DIAGRAM enhanced with Computer Network Diagrams solution from Computer and Networks area perfectly suits for drawing Network Layout Diagrams for different network topologies.
- 3d Cargo Ship Png
- Road Traffics Vector Images 3d Png
- 3d Circle Png
- 3D pictorial road map | Exporting ConceptDraw PRO document to ...
- Road 3d Png
- 3d Mountain Png
- Computer pictograms - Vector stencils library | UML Class Diagram ...
- Camera Video Vector 3d Icon Png
- 3d House Png
- 3d Building Icon Png
- Aircraft - Vector stencils library | Restaurant Floor Plan Software ...
- Vectors For Site Analysis Png
- 3d Pyramid With 5 Levels Png
- Person Vector Png
- Vehicular ad-hoc network | Landmarks - Vector stencils library | Inter ...
- Time Vector Png High Quality
- Train Station View Vector Png
- Watercraft - Vector stencils library | Watercraft - Vector stencils library ...
- Pyramid diagrams - Vector stencils library | 2-Level 3D pyramid ...
- 3D pictorial street map | The 100th Tour de France - Route map ...


-histograms---vector-stencils-library.png--diagram-flowchart-example.png)
-histograms---vector-stencils-library.png--diagram-flowchart-example.png)
