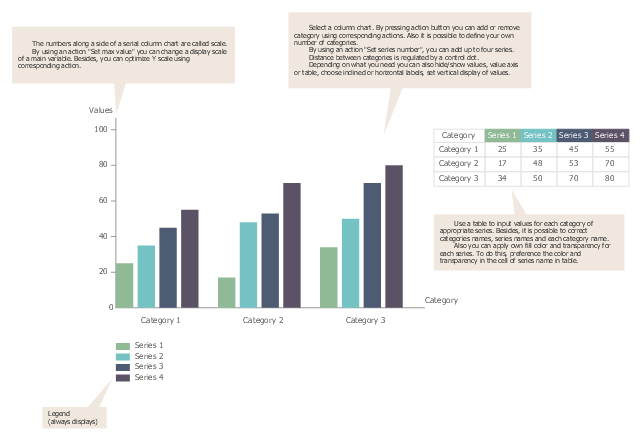
Use this bar graph template to design your column charts for 1-4 data series.
"Bar charts have a discrete range. Bar charts are usually scaled so all the data can fit on the chart. Bars on the chart may be arranged in any order. Bar charts arranged from highest to lowest incidence are called Pareto charts. Normally, bars showing frequency will be arranged in chronological (time) sequence. Grouped bar graph usually present the information in the same order in each grouping. Stacked bar graphs present the information in the same sequence on each bar.
Bar charts provide a visual presentation of categorical data. Categorical data is a grouping of data into discrete groups, such as months of the year, age group, shoe sizes, and animals. These categories are usually qualitative. In a column bar chart, the categories appear along the horizontal axis; the height of the bar corresponds to the value of each category." [Bar chart. Wikipedia]
The template "Bar chart" for the ConceptDraw PRO diagramming and vector drawing software is included in the Bar Graphs solution from the Graphs and Charts area of ConceptDraw Solution Park.
Template
Column Chart Template

Chart Maker for Presentations

Bar Chart Template

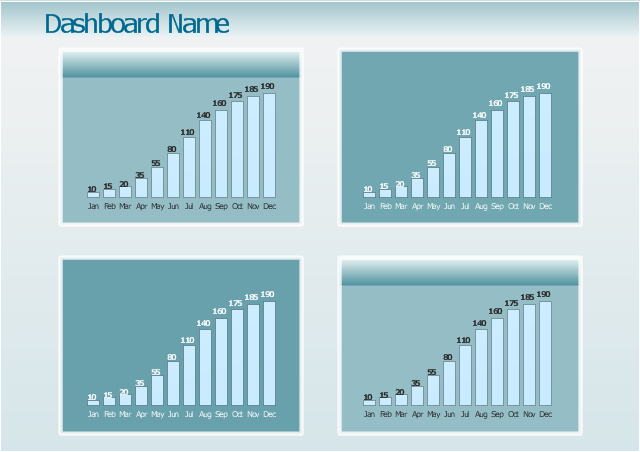
This dashboard template consist of 4 column charts. All these column charts are Live Objects displaying the data from the external source files. Use it to create your business performance management dashboard showing 4 time series of your metrics.
The business performance dashboard template "Time series digital dashboard" for the ConceptDraw PRO diagramming and vector drawing software is included in the Time Series Dashboard solution from the area "What is a Dashboard" of ConceptDraw Solution Park.
The business performance dashboard template "Time series digital dashboard" for the ConceptDraw PRO diagramming and vector drawing software is included in the Time Series Dashboard solution from the area "What is a Dashboard" of ConceptDraw Solution Park.
Time series digital dashboard - Template
Column Chart Examples

Bar Chart Template for Word

Rainfall Bar Chart

Chart Templates

How to Create a Column Chart

- Bar chart - Template | Bar Chart Examples | Bar Chart Software ...
- Bar Chart Template for Word | Column Chart Template | Chart Maker ...
- Double bar graph - Template | Bar Graph | Bar Chart Examples ...
- Bar chart - Template | Timeline Diagrams | Management Area ...
- Chart With Arrows
- Sales Growth. Bar Graphs Example | Bar Chart Template for Word ...
- Bar chart - Template | Process Flowchart | Basic Flowchart Symbols ...
- How to Draw a Divided Bar Chart in ConceptDraw PRO | Divided ...
- Project task status dashboard - Template | Sales Dashboard ...