Basic Flowchart Symbols and Meaning


ERD Symbols and Meanings


Data Flow Diagram Examples

Ordering Process Flowchart. Flowchart Examples

BPR Diagram. Business Process Reengineering Example

PDPC

Feature Comparison Chart Software

Physics Symbols

Process Flow Diagram Symbols

Flowchart design. Flowchart symbols, shapes, stencils and icons


Audit Flowchart Symbols

What's the best ERD tool for the Mac?

Process Flow Chart Examples

Value Stream Mapping Template

Workflow Diagram Symbols

Sales Process Flowchart Symbols

Entity Relationship Diagram - ERD - Software for Design Chen ER Diagrams
_Win_Mac.png "Entity Relationship Diagram - ERD - Software for Design <br>Chen ER Diagrams *")
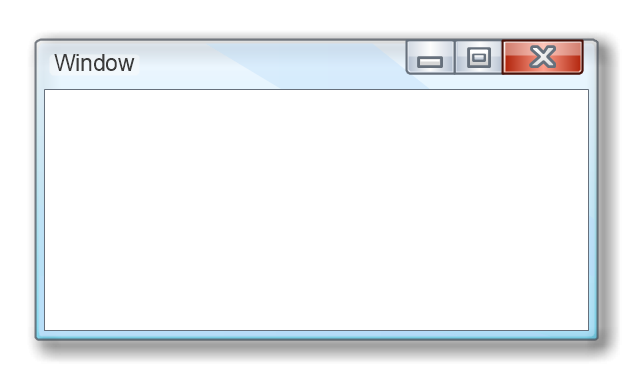
The vector stencils library "MS Windows Vista user interface" contains 76 MS Windows Vista design elements.
Use it for designing Microsoft ribbon graphic user interface (GUI) of software for computers with MS Windows Vista OS in the ConceptDraw PRO diagramming and vector drawing software extended with the Graphic User Interface solution from the Software Development area of ConceptDraw Solution Park.
Use it for designing Microsoft ribbon graphic user interface (GUI) of software for computers with MS Windows Vista OS in the ConceptDraw PRO diagramming and vector drawing software extended with the Graphic User Interface solution from the Software Development area of ConceptDraw Solution Park.
Window
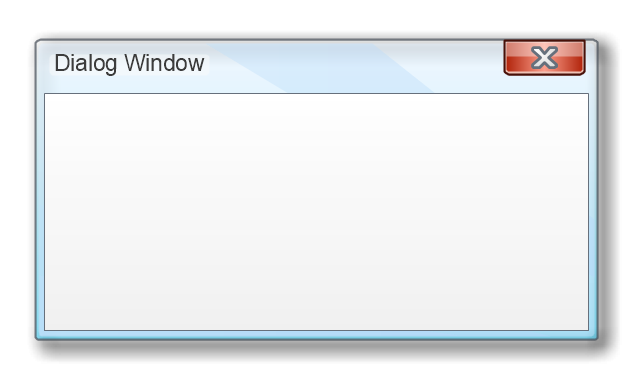
Dialog Window
Empty Window
Field

Horizontal Scrollbar
Vertical Scrollbar
Window Buttons
Window Buttons
Window Button 1

Window Button 2

Window Button 3

Window Button 4

Navigation

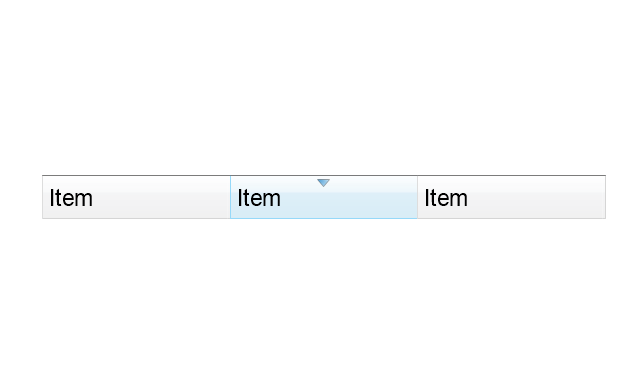
Menu Bar
Gradient Menu Bar
Drop-down Menu
Button
Toolbar Pannel

Tool Button

Primary Toolbar

Toolbar 1
Toolbar 2
Customizable Tollbar

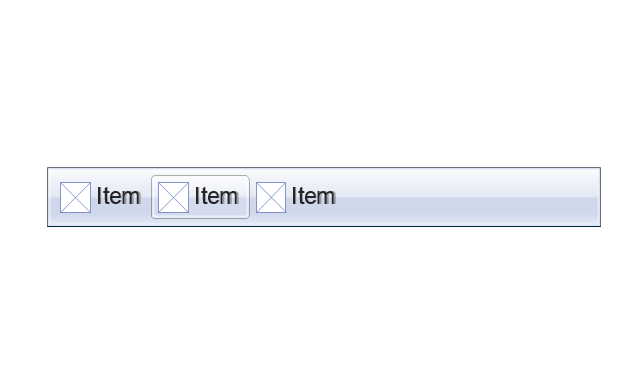
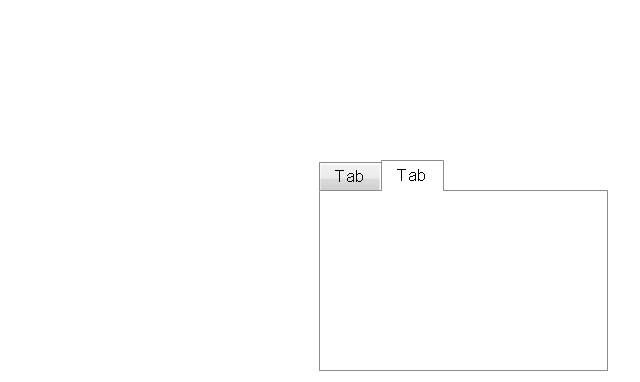
Tab View
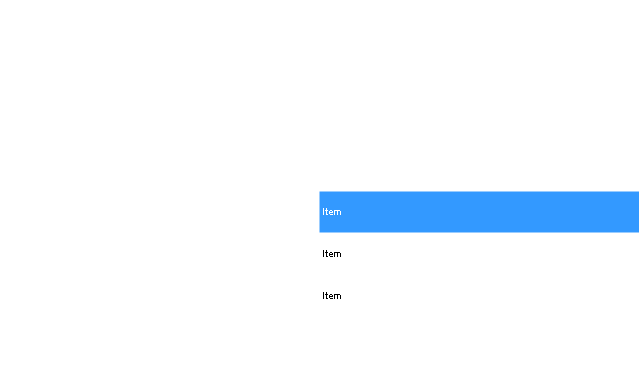
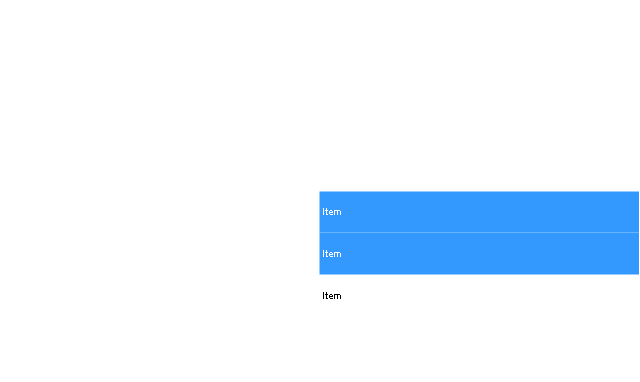
List View
Text Field
Vertical Separator

Horizontal Separator

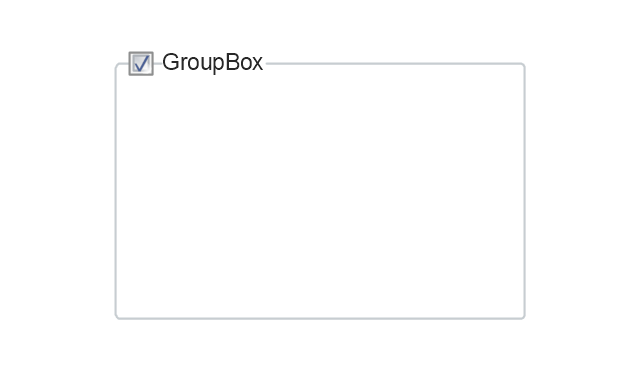
Group Box
Text Label

Link

Line Edit

Search

Search with Button

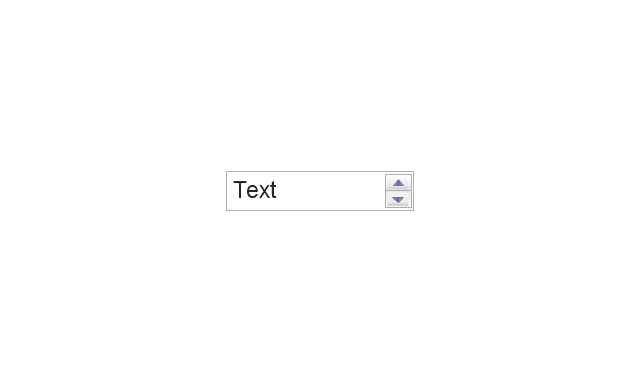
Spin Box
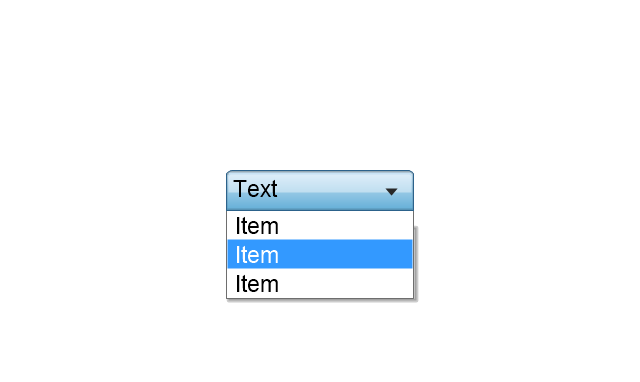
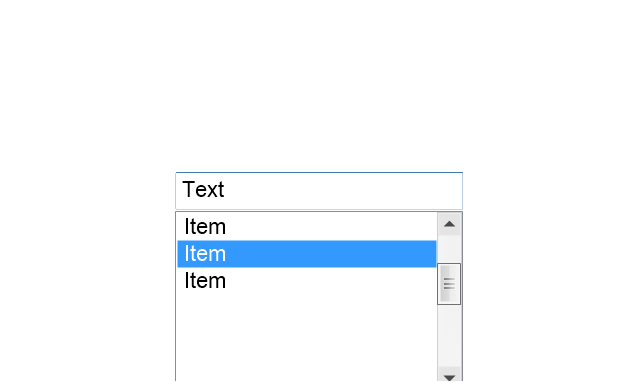
Combo-box
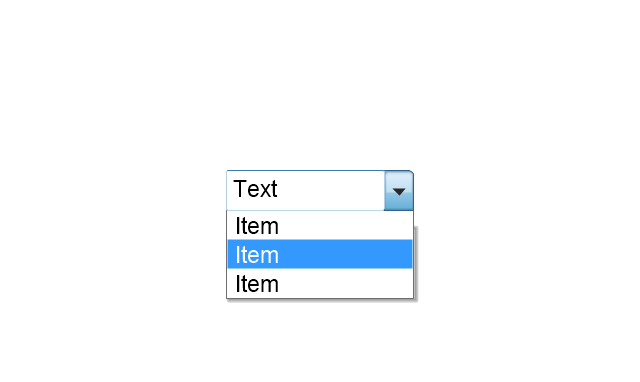
Editable Combo-box
Editable List Box
List Box
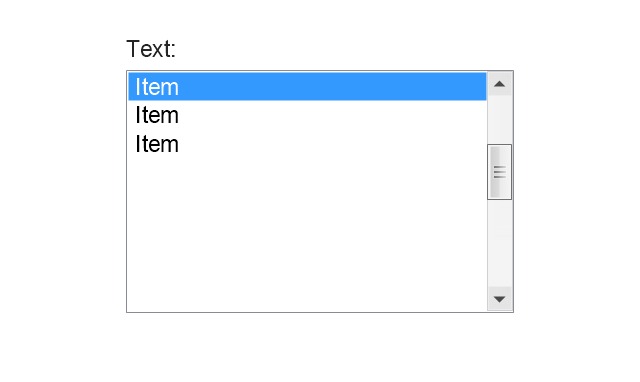
Single-selection List
Multiple-selection List
Check Box

Radio Button
Check box group
Radio Buttons Group
Progress Bar

Modal Progress Bar

Vertical Slider with Ticks
Horizontal Slider with Ticks
Dial

Catalogue Tree
Tree View 1
Tree View 2
Vertical Spacer

Horizontal Spacer

Chevron 1
Arrow 1
Arrow 2
Plus/Minus Control

Rotating Triangle

Chevron 3
Chevron 2
Normal Select Cursor

Link Select Cursor

Text Select Cursor

Working in Background Pointer

Busy Pointer

Unavailable Cursor

Precision Select Cursor

Error Icon
Warning Icon
Information Icon
Question Mark Icon
Balloon

Tooltip/Infotip

Calendar
Business Process Workflow Diagram


Multi Layer Venn Diagram. Venn Diagram Example

- Manufacturing 8 Ms fishbone diagram - Template | Total Quality ...
- 4 Ms fishbone diagram - Production process | Manufacturing 8 Ms ...
- PDPC | 5 Positive Effect Of Applying 4ms Of Production
- 4 Ms fishbone diagram - Production process | Manufacturing 8 Ms ...
- Fishbone Diagram | What Are The Positive Effects Of 4ms Of ...
- PDPC | What Are The Positive Effects Of 4ms Of Production
- Total Quality Management Value | Meaning Of 4ms
- Total Quality Management Value | Fishbone Diagram | 4ms Of ...
- 4 Ms fishbone diagram - Production process | Total Quality ...
- Manufacturing 8 Ms fishbone diagram - Template | Total Quality ...
- 4 Ms fishbone diagram - Production process | Data Flow Diagram ...
- 4 Ms fishbone diagram - Production process | Manufacturing 8 Ms ...
- Manufacturing 8 Ms fishbone diagram - Template | Total Quality ...
- 4 Ms fishbone diagram - Production process | Manufacturing 8 Ms ...
- Total Quality Management Value | Manufacturing 8 Ms fishbone ...
- What Is The 4ms Of Total Quality Management
- Manufacturing 8 Ms fishbone diagram - Template | Office Layout ...
- Process Flowchart | Data Flow Diagram Model | 4 Ms fishbone ...
- Fishbone Diagram Example For Manufacturing Industry
- Manufacturing 8 Ms fishbone diagram - Template | How Do ...