HelpDesk
How to Draw a Pie Chart

Pie Chart

Pie Chart Software

 Pie Charts
Pie Charts are extensively used in statistics and business for explaining data and work results, in mass media for comparison (i.e. to visualize the percentage for the parts of one total), and in many other fields. The Pie Charts solution for ConceptDraw DIAGRAM offers powerful drawing tools, varied templates, samples, and a library of vector stencils for simple construction and design of Pie Charts, Donut Chart, and Pie Graph Worksheets.
Pie Chart Examples and Templates

 Basic Pie Charts
This solution extends the capabilities of ConceptDraw DIAGRAM (or later) with templates, samples, and a library of vector stencils for drawing pie and donut charts.
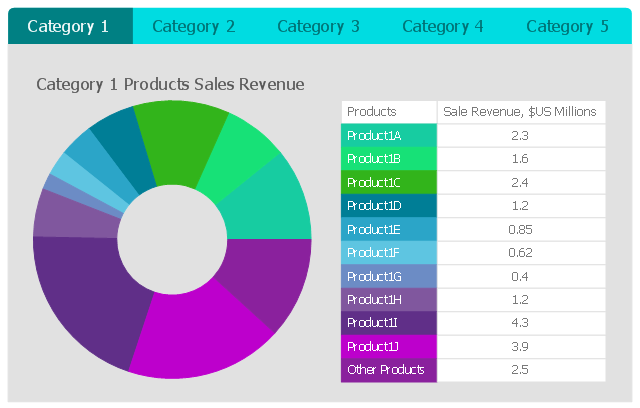
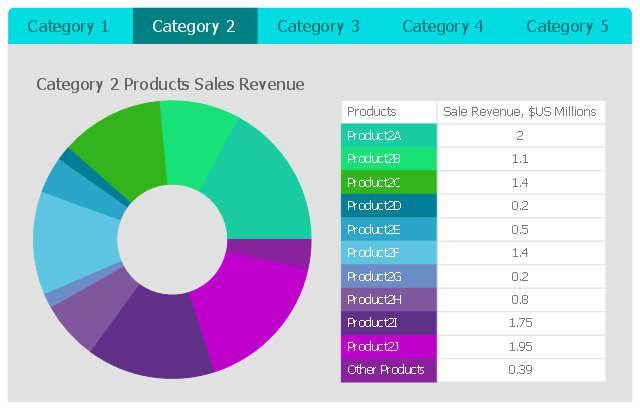
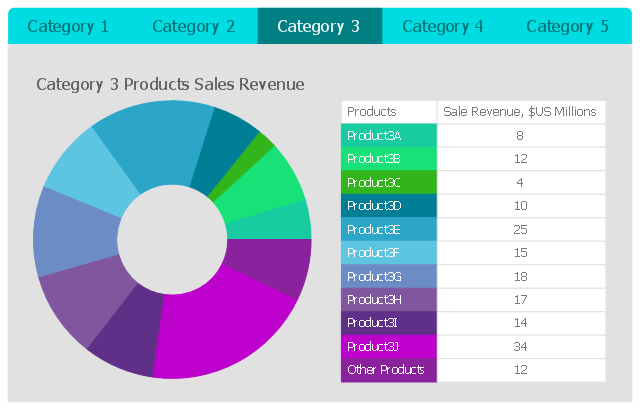
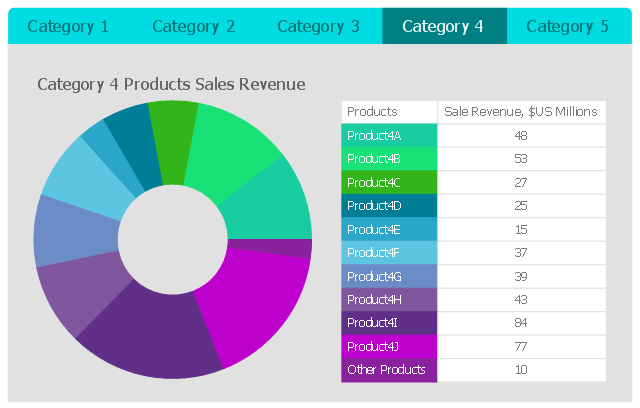
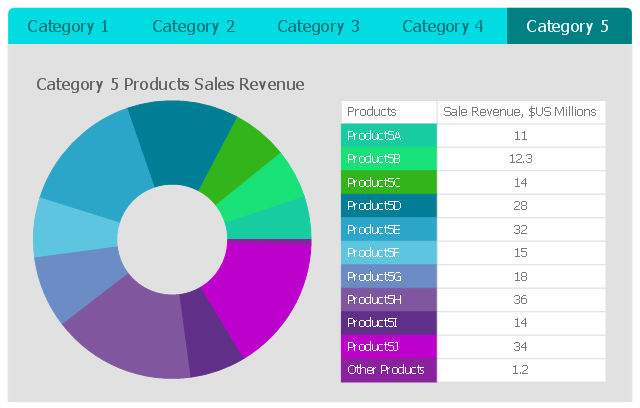
This business intelligence dashboard sample shows the quarter sales revenue for top 10 products by categories using donut charts.
"A doughnut chart (also spelled donut) is a variant of the pie chart, with a blank center allowing for additional information about the data as a whole to be included." [Pie chart. Wikipedia]
The BI dashboard example "Quarter Sales Revenue for Top 10 Products by Categories" was created using ConceptDraw PRO software extended with the Business Intelligence Dashboards solution from the Business Processes area of ConceptDraw Solution Park.
Category 1
Category 2
Category 3
Category 4
Category 5
Competitor Analysis

Chart Maker for Presentations

Bar Chart

Bar Chart Software

Column Chart Software

Examples of Flowcharts, Org Charts and More


What Is a Picture Graph?

 Business Intelligence Dashboard
Business Intelligence Dashboard solution extends the ConceptDraw DIAGRAM functionality with exclusive tools, numerous ready-to-use vector objects, samples and quick-start templates for creation professional Business Intelligence Dashboards, Business Intelligence Graphics, Business Intelligence Charts and Maps of different kinds. Design easy the BI dashboard, BI model or Dynamic chart in ConceptDraw DIAGRAM to monitor the company's work, to track the indicators corresponding your company's data, to display and analyze key performance indicators, to evaluate the trends and regularities of the processes occurring at the company.
- How to Draw the Different Types of Pie Charts | How to Create a Pie ...
- Arrow circle chart - Template | Pie Chart Software | How to Draw the ...
- How to Create a Pie Chart | Circular arrows diagrams - Vector ...
- Pie Chart Examples and Templates | Donut Chart Templates ...
- Circular arrows diagrams - Vector stencils library | Pie Chart ...
- Pie Chart Software | Doughnut chart - Template | Donut chart ...
- How to Draw the Different Types of Pie Charts | Virtuous circle ...
- Pie Chart Examples and Templates | Pie Charts | Pie Chart Software ...
- Basic Flowchart Symbols and Meaning | Arrow circle chart ...
- Pie Chart Examples and Templates | Atmosphere air composition ...
- Doughnut chart - Template | Donut Chart Templates | Pie Chart ...
- Pie Donut Chart. Pie Chart Examples
- Pie Chart Examples and Templates | Pie Chart Software | Doughnut ...
- How to Create a Pie Chart | How to Draw the Different Types of Pie ...
- Pie charts - Vector stencils library | Pie Chart Word Template. Pie ...
- Pie Chart Software | Pie Chart Examples and Templates | Pie Donut ...
- Pie Chart Of Circular Flow
- Donut Chart | Pie Chart Software | Pie Chart Examples and ...
- How to Draw the Different Types of Pie Charts | How to Create a Pie ...
- Dashboard Pie Chart