Donut Chart

Line Graph

Pie Chart Software

Pyramid Diagram

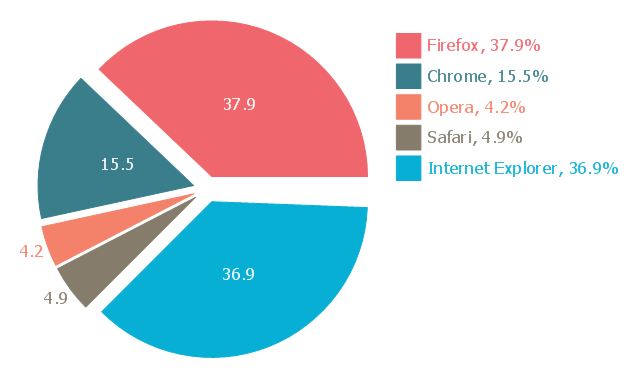
This exploded pie chart sample shows the Europe browser usage share in January 2011. It was designed on the base of the Wikimedia Commons file: 2011 01 Europe Browser share crop.png.
[commons.wikimedia.org/ wiki/ File:2011_ 01_ Europe_ Browser_ share_ crop.png]
This file is licensed under the Creative Commons Attribution 3.0 Unported license. [creativecommons.org/ licenses/ by/ 3.0/ deed.en]
"A chart with one or more sectors separated from the rest of the disk is known as an exploded pie chart. This effect is used to either highlight a sector, or to highlight smaller segments of the chart with small proportions." [Pie chart. Wikipedia]
The exploded pie chart example "Europe browser usage share" was created using the ConceptDraw PRO diagramming and vector drawing software extended with the Pie Charts solution of the Graphs and Charts area in ConceptDraw Solution Park.
Exploded pie chart
Line Chart Examples

SWOT Matrix

 Circle-Spoke Diagrams
Examples of subject areas that are well suited to this approach are marketing, business, products promotion, process modeling, market, resource, time, and cost analysis. Circle-Spoke Diagrams are successfully used in presentations, conferences, management documents, magazines, reportages, reviews, reports, TV, and social media.
HelpDesk
How to Add Data-driven Infographics to MS Word Document

Bar Chart Examples

Competitor Analysis

Pyramid Diagram

Pyramid Chart Examples

Examples of Flowcharts, Org Charts and More


 Line Graphs
How to draw a Line Graph with ease? The Line Graphs solution extends the capabilities of ConceptDraw DIAGRAM with professionally designed templates, samples, and a library of vector stencils for drawing perfect Line Graphs.
- Pie charts - Vector stencils library | Pie Chart Word Template. Pie ...
- Circular diagrams - Vector stencils library | Pie charts - Vector ...
- Circular diagrams - Vector stencils library | Pie Chart Word Template ...
- Pie Charts | Arrow circle chart - Template | Pie Chart Examples and ...
- Pie Chart 3 Sections Vector
- Pie Chart Examples and Templates | Donut Chart | Pie Chart ...
- 5 -Set Venn diagram - Template | Circular diagrams - Vector stencils ...
- 5 Segment Pentagon
- Circular diagrams - Vector stencils library | Design elements ...
- How to Draw a Circular Arrows Diagram Using ConceptDraw PRO ...
- Blank 5 Section Pyramid
- Pyramid Diagram and Pyramid Chart | How to Draw a Pie Chart ...
- Pie Chart Examples and Templates | Exploded pie chart ...
- Percentage Pie Chart . Pie Chart Examples | How to Draw the ...
- Marketing mix - Wheel diagram | Target diagrams - Vector stencils ...
- Vector Diagram Circle 5 Sections
- 5 Circular Ring Vector
- Exploded pie chart - European Parliament election | Europe browser ...
- Circular diagrams - Vector stencils library | SWOT - Vector stencils ...
- Atmosphere air composition | Percentage Pie Chart . Pie Chart ...