 Bubble Diagrams
Bubble diagrams have enjoyed great success in software engineering, architecture, economics, medicine, landscape design, scientific and educational process, for ideas organization during brainstorming, for making business illustrations, presentations, planning, design, and strategy development. They are popular because of their simplicity and their powerful visual communication attributes.
 Scatter Diagrams
The Scatter Diagrams solution extends ConceptDraw PRO v10 functionality with templates, samples, and a library of vector stencils that make construction of a Scatter Plot easy. The Scatter Chart Solution makes it easy to design attractive Scatter Diagrams used in various fields of science, work, and life activities. ConceptDraw PRO lets you enter the data to the table and construct the Scatter Plot Graph automatically according to these data.
 Line Graphs
How to draw a Line Graph with ease? The Line Graphs solution extends the capabilities of ConceptDraw PRO v10 with professionally designed templates, samples, and a library of vector stencils for drawing perfect Line Graphs.
Histogram
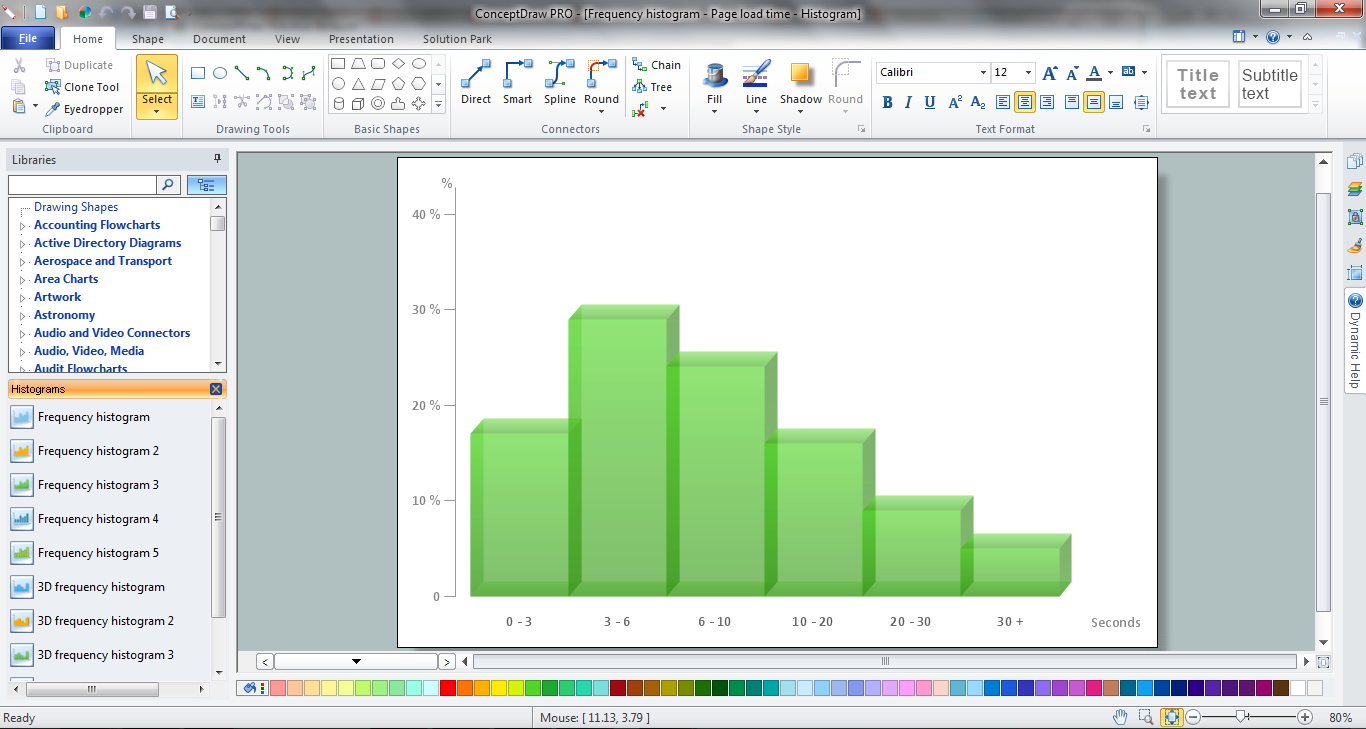
ConceptDraw PRO diagramming and vector drawing software offers the Histograms solution from the Graphs and Charts area of ConceptDraw Solution Park with powerful tools to help you draw a Histogram of any complexity quick and easy.The Best Flowchart Software Available
ConceptDraw gives the ability to draw Flowchart documents. Flowcharts solutionis a powerful tool that extends ConceptDraw application for drawing business flowcharts.ConceptDraw PRO vector diagramming and business graphics software enhanced with with templates, green and interactive flowchart makers, samples and stencil libraries from ConceptDraw Solution Park which all focused to help with drawing flowcharts, block diagrams, bar charts, histograms, pie charts, divided bar diagrams, line graphs, area charts, scatter plots, circular arrows diagrams, Venn diagrams, bubble diagrams, concept maps, and others.

Technical Flow Chart
Flow chart is a diagrammatic representation of an algorithm and essential part of planning the system. Flow charts are widely used in technical analysis and programming for easy writing programs and explaining them to others. So, one of the most popular type of flow charts is Technical Flow Chart.Technical Flow Chart can be drawn by pencil on the paper, but it will be easier to use for designing a special software. ConceptDraw PRO diagramming and vector drawing software extended with Flowcharts Solution from the "What is a Diagram" Area of ConceptDraw Solution Park will be useful for this goal.
Line Graph
ConceptDraw PRO extended with Line Graphs solution from Graphs and Charts area of ConceptDraw Solution Park is ideal software for quick and simple drawing professional looking line graph.Pie Chart Software
A pie chart is a circular diagram showing a set of data divided into proportional slices. There are several variations of this chart such as donut chart, exploded pie chart, multi-level pie charts. Although it is not very informative when a ring chart or circle chart has many sections, so choosing a low number of data points is quite important for a useful pie chart.ConceptDraw PRO software with Pie Charts solution helps to create pie and donut charts for effective displaying proportions in statistics, business and mass media for composition comparison, i.e. for visualization of part percentage inside one total.
 Project Management Area
Project Management area provides Toolbox solutions to support solving issues related to planning, tracking, milestones, events, resource usage, and other typical project management functions.
- Venn Diagrams | How to Create a Venn Diagram in ConceptDraw ...
- Context Diagram Template | 5 - Set Venn diagram - Template | How ...
- 3 Set Venn Diagram
- Workflow Diagram Template | Process flow diagram (PFD) template ...
- How to Create the Custom Diagram Template on Mac | Six Markets ...
- Pyramid Chart Examples | Pyramid Diagrams | Computer and ...
- Association football (soccer) formation 2–3– 5 (pyramid) | Soccer ...
- Management Tools — Total Quality Management | Multi Layer Venn ...
- Workflow Diagram Template | How to Create the Custom Diagram ...
- Marketing Diagrams | Block diagram - Marketing targeting ...
- Basic Diagramming | Mathematical Diagrams | Physics Symbols ...
- Winter Sports. Illustrations and Visualize Statistics | Workflow ...
- Circle-spoke diagram - Target market | Target Diagram | Circular ...
- Target market - Onion diagram | Target diagrams - Vector stencils ...
- 5 Level pyramid model diagram - Information systems types ...
- Fish Diagram Template Word
- Mathematical Diagrams | Mathematics | Basic Diagramming ...
- Process Flowchart | Entity Relationship Diagram Symbols and ...
- Marketing Diagrams | Marketing Analysis Diagram | Marketing mix ...
- Cause and effect diagram - Increase in productivity | Design ...


