Total Quality Management Value
The Total quality management (TQM) is an enterprise-wide method of continuous quality improvement of all organizational processes, including the enhancement of ability to deliver high-quality products and services to the customers. The TQM includes eight main elements, which have great value: customer-focused, process-centered, total employee involvement, integrated system, continual improvement, strategic and systematic approach, fact-based decision making, communications. ConceptDraw DIAGRAM diagramming and vector drawing software offers the Total Quality Management Diagram solution with effective drawing tools, predesigned vector elements, samples and templates that help easy design the Total Quality Management diagrams, TQM flowcharts and Mind Maps widely used in quality management projects to visualize the business processes and industrial processes for your organization, to demonstrate the quality control step-by-step in a visual manner, to compare visually the ideal and real stages of processes.Interior Design. Machines and Equipment — Design Elements
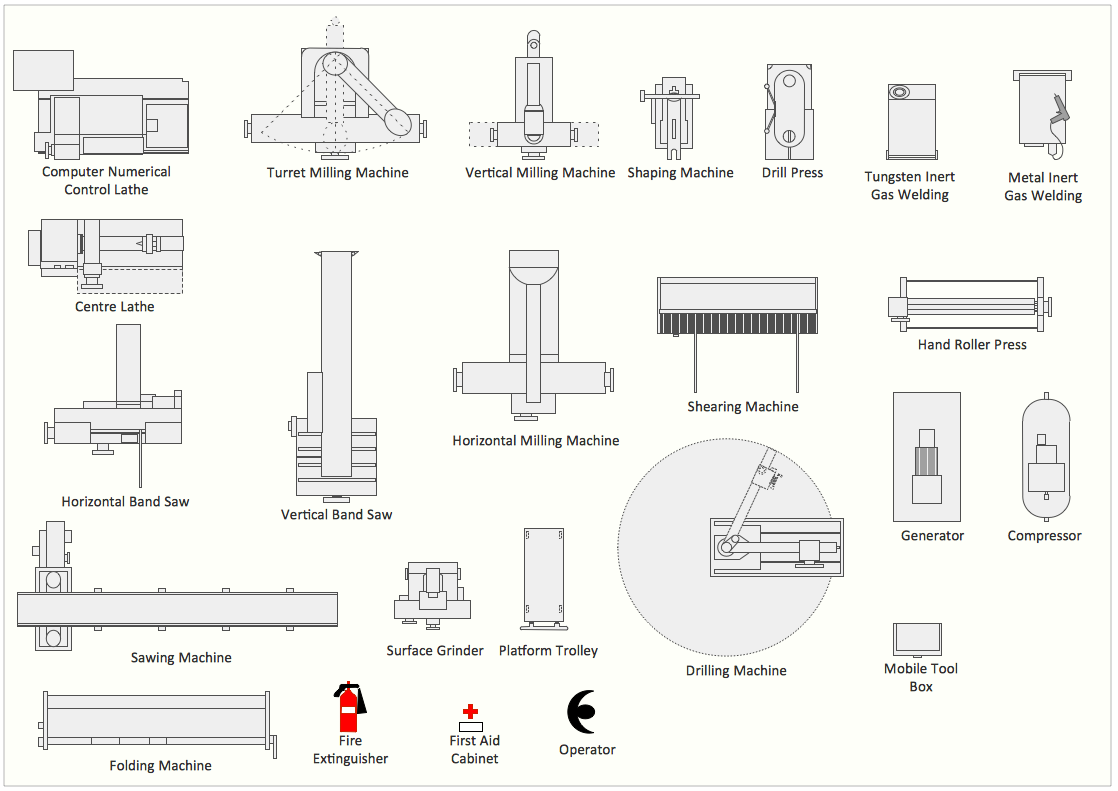
The Interior Design for the plant or any other industrial or manufacturing premise is equally important than for the home, office, etc. Its main goal is to be convenient and comfortable, providing favorable atmosphere for effective and productive work of workers. Good plant plan should illustrate the common plan of the premise and depict in details the distribution of special equipment and industrial machines within plant's premises. ConceptDraw DIAGRAM diagramming and vector drawing software extended with exclusive Plant Layout Plans solution from Building Plans area of ConceptDraw Solution Park is a powerful plant design software, which offers extensive libraries with vector design elements of machines and equipment, also storage, distribution, shipping and receiving facilities. They make easy development of Plant Layouts for production, receiving, storage, distribution, transport, and shipping of manufactured goods, Manufacturing equipment layouts, Plant layout plans, Plant interior design plans, Warehouse and Workshop floor plan layouts, etc.Flowchart Definition
Flowchart definition - A Flowchart is a diagram that graphically represents the structure of the system, the flow of steps in a process, algorithm, or the sequence of steps and decisions for execution a process or solution a problem. For depiction the steps there are used specific shapes and graphic symbols which are linked by lines and directional arrows. The main standard shapes are rectangle or box, rounded box, diamond, circle. A Flowchart is a convenient way to observe the follow the process from beginning to end, it lets improve the work of process, highlight the key elements and detach not essential or even excessive steps. The Flowcharts can represent different levels of detail: High-Level Flowchart, Detailed Flowchart, and Deployment or Matrix Flowchart. They are incredibly useful for programmers when developing the programs of any complexity and on any high level language. Create your own Flowcharts using the ConceptDraw DIAGRAM diagramming and vector drawing software and powerful tools of Flowcharts solution from "Diagrams" area.Wireless Network Diagram Examples
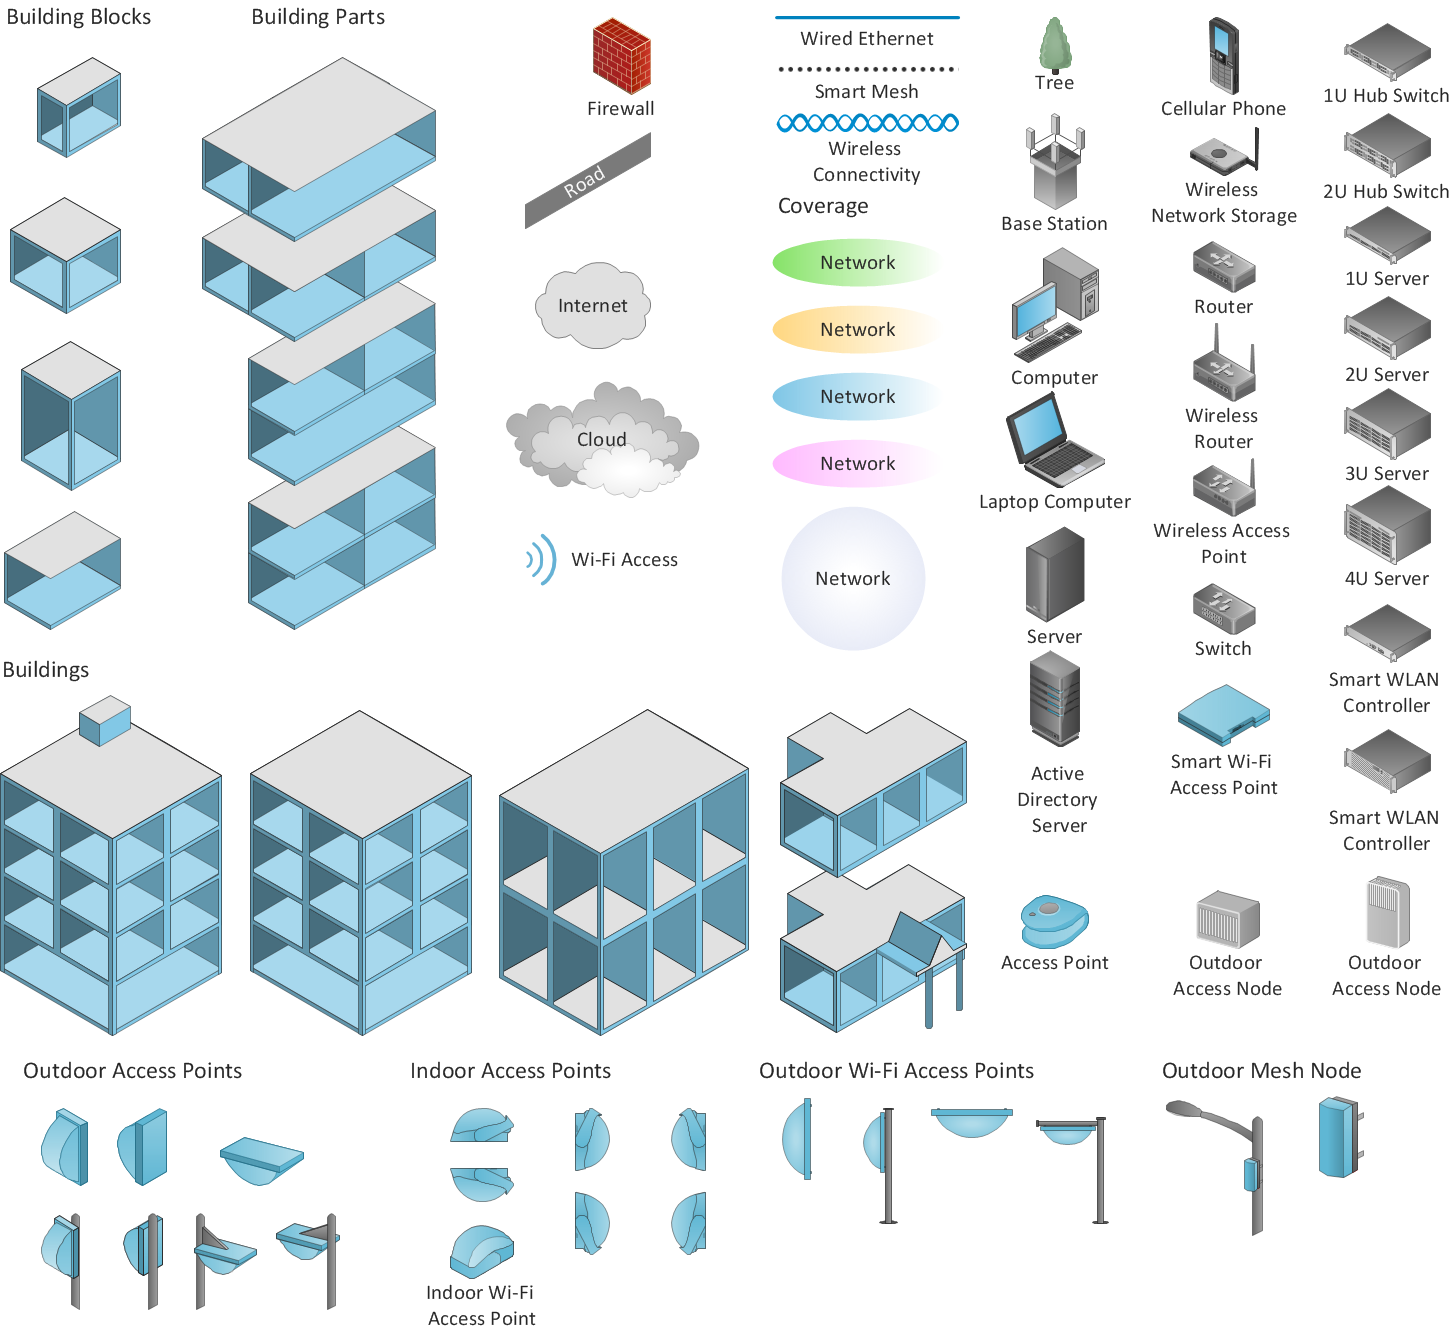
ConceptDraw Wireless Network solution includes several wireless network diagram examples that users can modify and make your own diagram.Computer Network Architecture. Computer and Network Examples
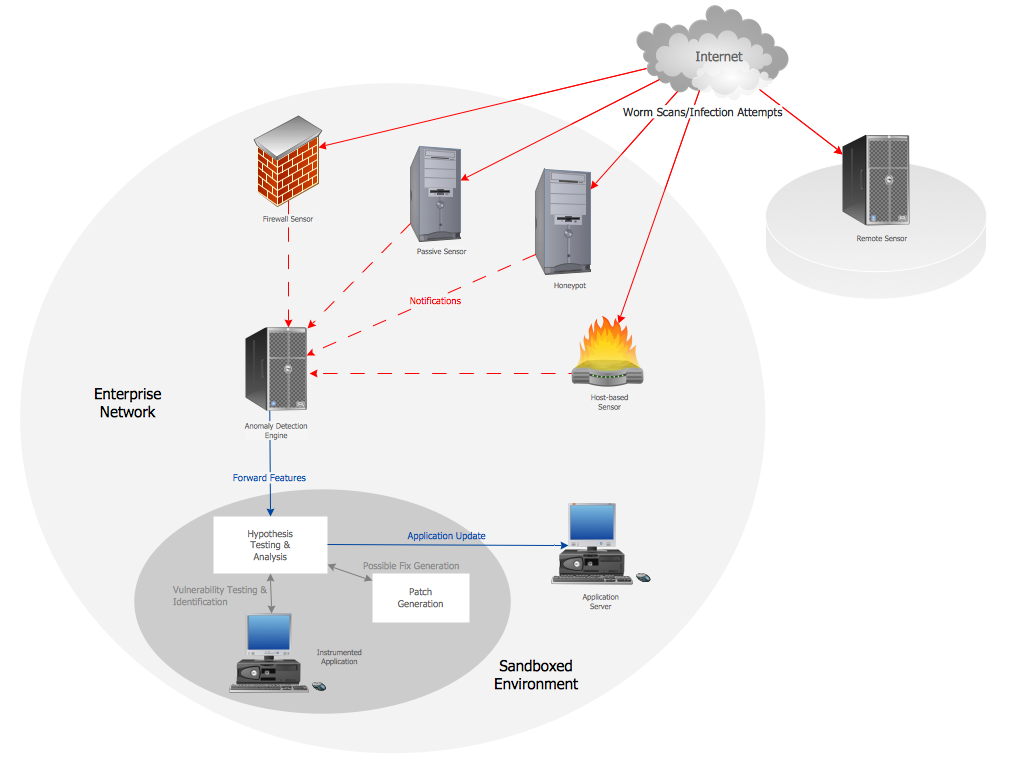
The network architecture and design specialization will help you gain the technical leadership skills you need to design and implement high-quality networks that support business needs.
 Business Process Model and Notation
Business Process Model and Notation Solution for ConceptDraw DIAGRAM is helpful for modeling the business processes of any degree of complexity, documenting them and effective creating diagrams using the BPMN 2.0 standard.
 Azure Architecture
Azure Architecture solution bundles into one handy tool everything you need to create effective Azure Architecture diagrams. It adds the extra value to versatile ConceptDraw DIAGRAM software and extends the users capabilities with comprehensive collection of Microsoft Azure themed graphics, logos, preset templates, wide array of predesigned vector symbols that covers the subjects such as Azure management, Azure storage, and Azure services, amongst others, and allow you to illustrate Azure Architecture diagrams at any degree of complexity, to present visually your Azure cloud system architecture with professional style, to design Azure cloud topology, to document Windows Azure Architecture and Azure Cloud System Architecture, to visualize the great abilities and work of Microsoft Azure Cloud System and Azure services.
Business Graphics Software
ConceptDraw DIAGRAM is a business graphics software that allows you improve your business using Sales Performance Dashboard helps you analyze your data more efficiently.
 ATM UML Diagrams
The ATM UML Diagrams solution lets you create ATM solutions and UML examples. Use ConceptDraw DIAGRAM as a UML diagram creator to visualize a banking system.
- Flow chart Example . Warehouse Flowchart | 5s Form
- 5s Warehouse Examples
- Business diagrams & Org Charts with ConceptDraw PRO | 5s ...
- Business Process Mapping | Graphic User Interface | Management 5s
- Contact Card | Graphical User Interface Examples | PM Planning ...
- 5s Diagram
- Gantt Chart 5s
- Flowchart 5s
- Usb Iphone 5s Cable Connection Diagram


