This site uses cookies. By continuing to browse the ConceptDraw site you are agreeing to our Use of Site Cookies.

Flowchart Definition

Flowchart definition - A Flowchart is a diagram that graphically represents the structure of the system, the flow of steps in a process, algorithm, or the sequence of steps and decisions for execution a process or solution a problem. For depiction the steps there are used specific shapes and graphic symbols which are linked by lines and directional arrows. The main standard shapes are rectangle or box, rounded box, diamond, circle. A Flowchart is a convenient way to observe the follow the process from beginning to end, it lets improve the work of process, highlight the key elements and detach not essential or even excessive steps. The Flowcharts can represent different levels of detail: High-Level Flowchart, Detailed Flowchart, and Deployment or Matrix Flowchart. They are incredibly useful for programmers when developing the programs of any complexity and on any high level language. Create your own Flowcharts using the ConceptDraw DIAGRAM diagramming and vector drawing software and powerful tools of Flowcharts solution from "Diagrams" area.

Cross Functional Flowchart Symbols

The excellent possibility to create attractive Cross Functional Flowcharts for step-by-step visualization the operations of a business process flow of any degree of detailing is offered by ConceptDraw’s Cross-Functional Flowcharts solution. The extensive selection of commonly used vector cross functional flowchart symbols allow you to demonstrate the document flow in organization, to represent each team member’s responsibilities and how processes get shared or transferred between different teams and departments.

Total Quality Management Value

The Total quality management (TQM) is an enterprise-wide method of continuous quality improvement of all organizational processes, including the enhancement of ability to deliver high-quality products and services to the customers. The TQM includes eight main elements, which have great value: customer-focused, process-centered, total employee involvement, integrated system, continual improvement, strategic and systematic approach, fact-based decision making, communications. ConceptDraw DIAGRAM diagramming and vector drawing software offers the Total Quality Management Diagram solution with effective drawing tools, predesigned vector elements, samples and templates that help easy design the Total Quality Management diagrams, TQM flowcharts and Mind Maps widely used in quality management projects to visualize the business processes and industrial processes for your organization, to demonstrate the quality control step-by-step in a visual manner, to compare visually the ideal and real stages of processes.

Interior Design. Machines and Equipment — Design Elements

The Interior Design for the plant or any other industrial or manufacturing premise is equally important than for the home, office, etc. Its main goal is to be convenient and comfortable, providing favorable atmosphere for effective and productive work of workers. Good plant plan should illustrate the common plan of the premise and depict in details the distribution of special equipment and industrial machines within plant's premises. ConceptDraw DIAGRAM diagramming and vector drawing software extended with exclusive Plant Layout Plans solution from Building Plans area of ConceptDraw Solution Park is a powerful plant design software, which offers extensive libraries with vector design elements of machines and equipment, also storage, distribution, shipping and receiving facilities. They make easy development of Plant Layouts for production, receiving, storage, distribution, transport, and shipping of manufactured goods, Manufacturing equipment layouts, Plant layout plans, Plant interior design plans, Warehouse and Workshop floor plan layouts, etc.

Sales Teams are Inherently Competitive

Sales teams are inherently competitive, so you don't need to invent extra ways to stimulate the competition. At the same time, you can provide the team with a sales dashboard shows company, team and personal KPI to make the competition clear.

Sales Analytics

With Sales Dashboard solution for ConceptDraw DIAGRAM sales analytics become as simple and visual as never before. Visualizing sales data using ConceptDraw Sales Dashboard allows you keep all KPI on the one page and see how your business can improve.

Network Diagramming with ConceptDraw DIAGRAM

At the moment computer networks are widespread, various types of computer networks are constructed around the world, operate and interact with each other. There are many kinds of computer networks that differ in the transmission medium, in communications protocols, in size, topology, organizational intent, and also in territorial basis. There are popular such types of computer networks as Global Area Network (GAN), Wide Area Network (WAN), Metropolitan Area Network (MAN), Local Area Network (LAN). 
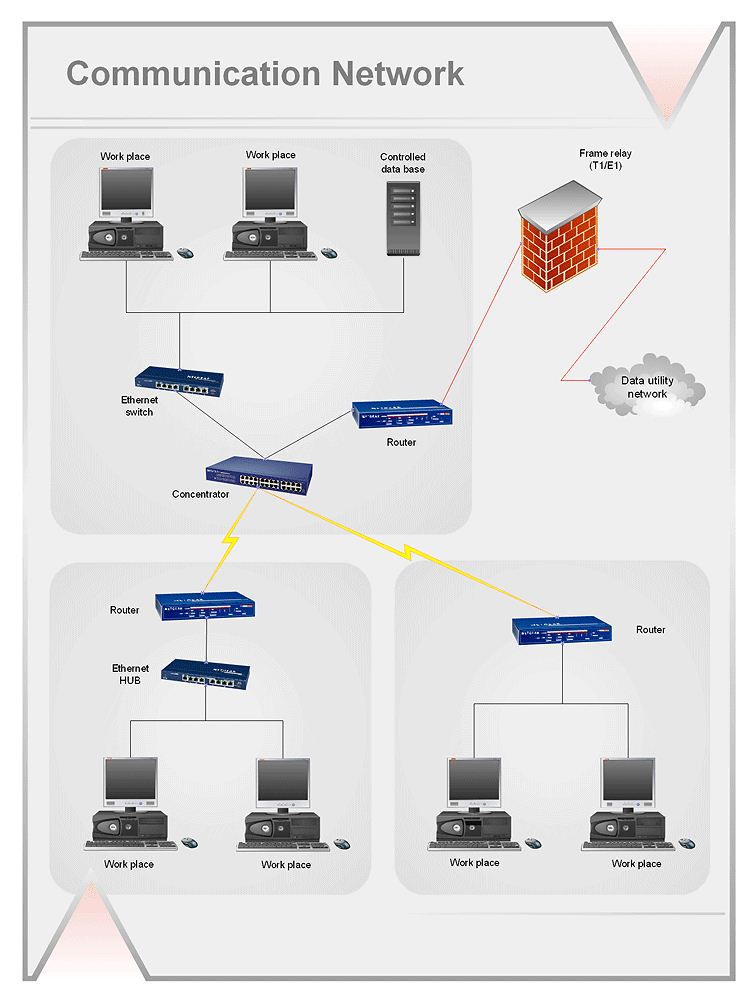
ConceptDraw DIAGRAM is a powerful network diagramming software, perfect for software engineers, software designers and software developers who need to draw Computer Network diagrams, designs, schematics, and network maps in no time. The pre-drawn shapes representing computers, network devices and smart connectors offered by ConceptDraw solutions help to create the accurate diagrams and documentation, represent computer network topologies and designs, depict Computer network architectures, logical, physical, cable networks, and vehicular networks.

Business Graphics Software

ConceptDraw DIAGRAM is a business graphics software that allows you improve your business using Sales Performance Dashboard helps you analyze your data more efficiently.

KPI Dashboard

ConceptDraw DIAGRAM diagramming and vector drawing software supplied with Sales Dashboard solution from the Marketing area of ConceptDraw Solution Park provides the full set of useful tools which make it the best for producing the live KPI Dashboard of any complexity.