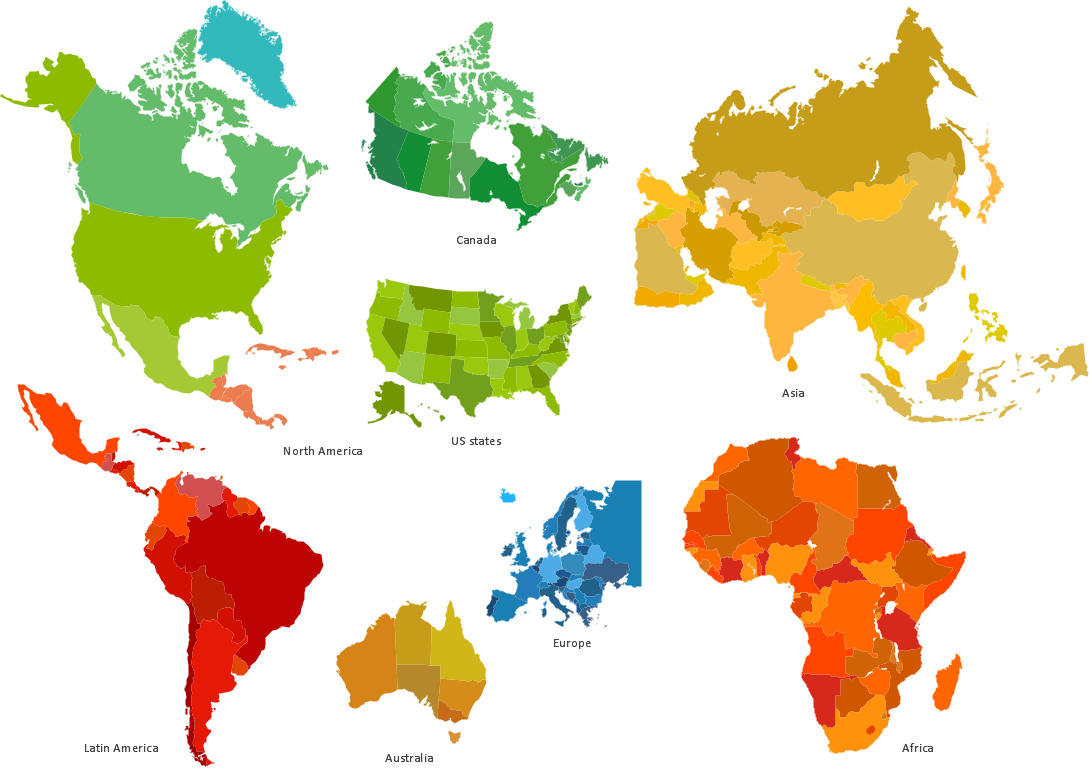
Informative and Well-Designed Infographics
Informative and well-designed Infographics allows visually present various map containing information.
 Pie Charts
Pie Charts are extensively used in statistics and business for explaining data and work results, in mass media for comparison (i.e. to visualize the percentage for the parts of one total), and in many other fields. The Pie Charts solution for ConceptDraw PRO v10 offers powerful drawing tools, varied templates, samples, and a library of vector stencils for simple construction and design of Pie Charts, Donut Chart, and Pie Graph Worksheets.
 Continent Maps
Continent Maps solution extends ConceptDraw PRO software with templates, samples and libraries of vector stencils for drawing the thematic maps of continents, state maps of USA and Australia.
 Germany Map
The Germany Map solution contains collection of samples, templates and scalable vector stencil graphic maps, representing map of Germany and all 16 states of Germany. Use the Germany Map solution from ConceptDraw Solution Park as the base for various them
- A Bar Graph Representing Area Of 7 Continents
- Rainfall Bar Chart | Picture Graph | Bar Charts | How To Draw Bar ...
- Pie Graph Of 7 Continents
- Represent The Area Of 7 Continents On Bar Graph
- Graphs Of 7 Continents
- World Continents Map | 7 Continents Map | Map of Continents ...
- 7 Continents Map | Informative and Well-Designed Infographics ...
- Continent Maps | Bar Graphs | Basic Bar Graphs | Bar Graph On ...
- 7 Continents Map | Informative and Well-Designed Infographics ...
