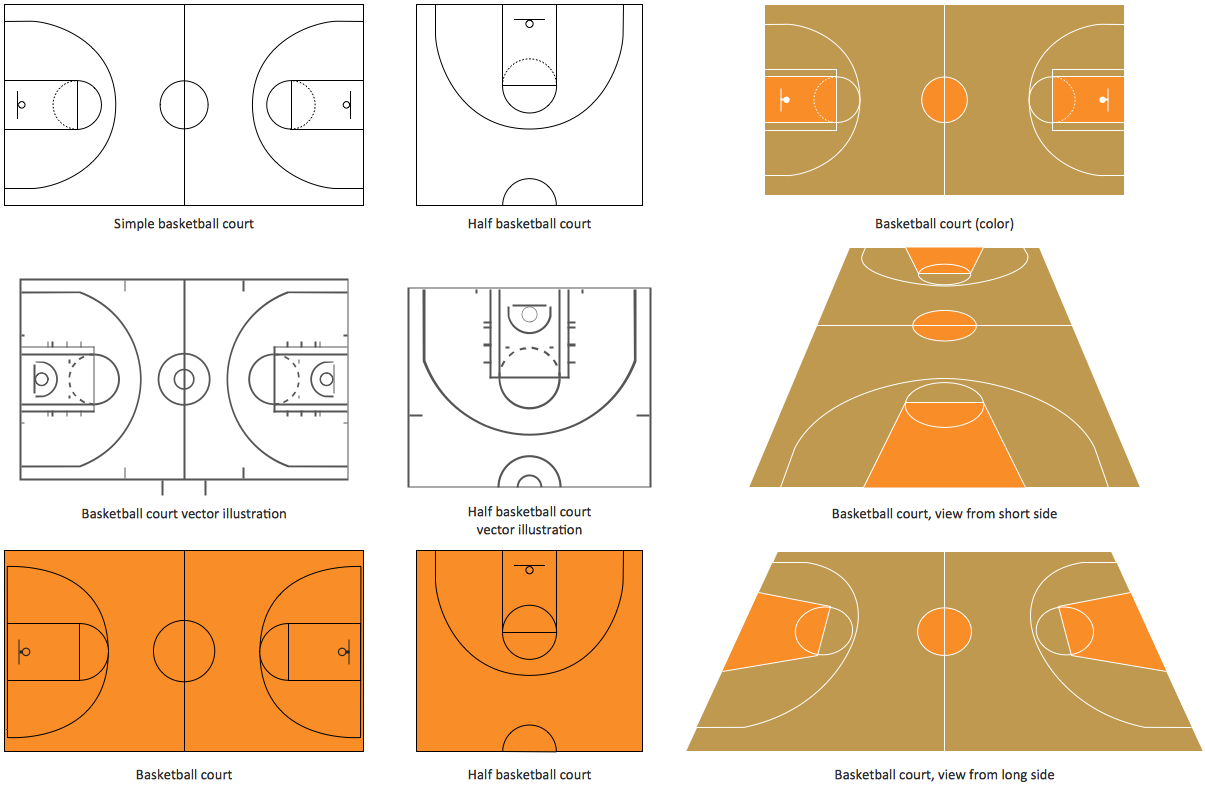
Basketball Court Diagram and Basketball Positions
 25 Typical Orgcharts
The 25 Typical Orgcharts solution contains powerful organizational structure and organizational management drawing tools, a variety of professionally designed organization chart and matrix organization structure samples, 25 templates based on various orga
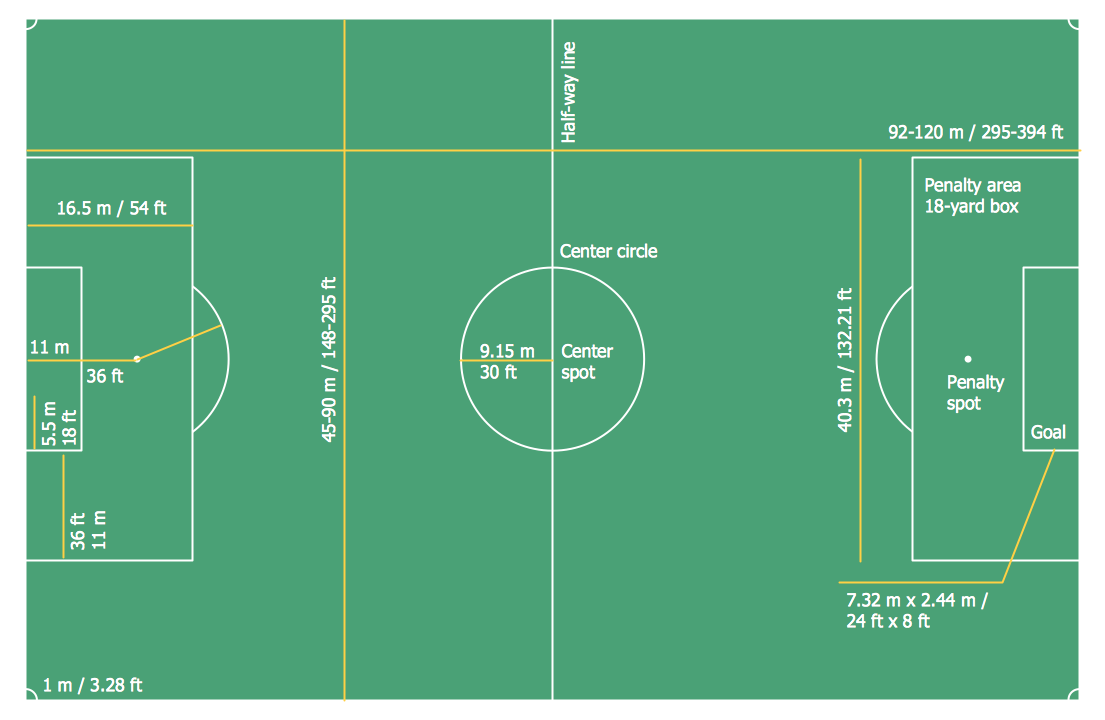
Soccer (Football) Dimensions
UML Diagram

How to Draw EPC Diagram Quickly


 Sales Dashboard
Sales Dashboard solution extends ConceptDraw DIAGRAM software with templates, samples and library of vector stencils for drawing the visual dashboards of sale metrics and key performance indicators (KPI).
 Australia Map
For graphic artists creating accurate maps of Australia. The Australia Map solution - allows designers to map Australia for their needs, offers a collection of scalable graphics representing the political geography of Australia, split into distinct state
 Continent Maps
Continent Maps solution extends ConceptDraw DIAGRAM software with templates, samples and libraries of vector stencils for drawing the thematic maps of continents, state maps of USA and Australia.
 Flowcharts
The Flowcharts solution for ConceptDraw DIAGRAM is a comprehensive set of examples and samples in several varied color themes for professionals that need to represent graphically a process. Solution value is added by the basic flow chart template and shapes' libraries of flowchart notation. ConceptDraw DIAGRAM flow chart creator lets one depict the processes of any complexity and length, as well as design the Flowchart either vertically or horizontally.
 Marketing Diagrams
Marketing Diagrams solution extends ConceptDraw DIAGRAM diagramming software with abundance of samples, templates and vector design elements intended for easy graphical visualization and drawing different types of Marketing diagrams and graphs, including Branding Strategies Diagram, Five Forces Model Diagram, Decision Tree Diagram, Puzzle Diagram, Step Diagram, Process Chart, Strategy Map, Funnel Diagram, Value Chain Diagram, Ladder of Customer Loyalty Diagram, Leaky Bucket Diagram, Promotional Mix Diagram, Service-Goods Continuum Diagram, Six Markets Model Diagram, Sources of Customer Satisfaction Diagram, etc. Analyze effectively the marketing activity of your company and apply the optimal marketing methods with ConceptDraw DIAGRAM software.
- Soccer (Football) Formation | Baseball Diagram – Defence Positions ...
- Soccer (Football) Formation | Baseball Diagram – Defence Positions ...
- Soccer (Football) Formation | Football – 2014 FIFA World Cup ...
- Winter Sports Vector Clipart. Medal Map. Spatial Infographics ...
- Winter Sports | Sport pictograms. Olympic Games | Sochi 2014 ...
- Sochi 2014 Olympics - Men's hockey tournament schedule ...
- Winter Sports | Sochi 2014 Olympics - Men's hockey tournament ...
- Baseball Diagram – Defence Positions | Design elements - Football ...
- Winter Sports | Winter Olympics - Freestyle skiing | Winter Sports ...
- Winter Sports. Using Olympic Games Clipart to Illustrate Tournament ...
- How to Make Soccer Position Diagram Using ConceptDraw PRO ...
- Winter Sports. Olympic Games Illustrations. Medal Summary | Winter ...
- Basketball Court Diagram and Basketball Positions | How to Make ...
- Winter Sports Vector Clipart. Medal Map. Spatial Infographics ...
- Winter Sports Vector Clipart. Medal Map. Spatial Infographics ...