How Do Fishbone Diagrams Solve Manufacturing Problems
How do Fishbone diagrams solve manufacturing problems? Fishbone diagrams are successfully used in various fields of industries and manufacturing to analyze the set of possible causes and their effects. Fishbone diagram provides a process to clearly define the “Effect” and then puts you to thinking about the possible causes, based on the categories of common problems in manufacturing.ConceptDraw PRO application extended with Fishbone Diagrams solution lets you construct Fishbone diagrams and represent globally recognized standards for manufacturing 6 Ms and 8 Ms.
"Causes in the diagram are often categorized, such as to ...
The 7 Ps (used in marketing industry):
(1) Product/ Service;
(2) Price;
(3) Place;
(4) Promotion;
(5) People/ personnel;
(6) Positioning;
(7) Packaging. " [Ishikawa diagram. Wikipedia]
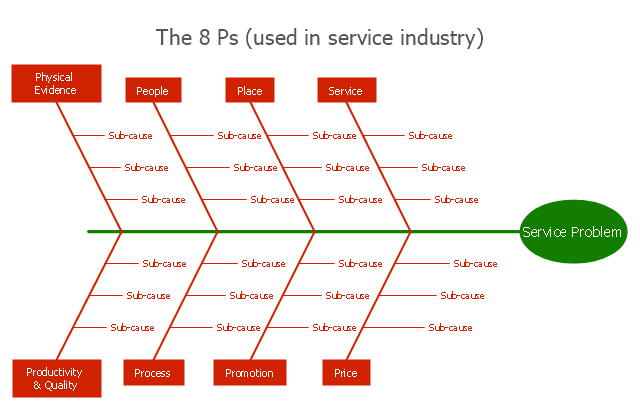
This 8 Ps Ishikawa diagram (service cause and effect diagram) template is included in the Fishbone Diagram solution from the Management area of ConceptDraw Solution Park.
Fishbone Diagram Procedure
ConceptDraw PRO diagramming and vector drawing software enhanced with Fishbone Diagrams solution from the Management area of ConceptDraw Solution Park gives the ability to draw Fishbone diagram, which identifies many possible causes for an effect for problem solving. Fishbone Diagram procedure of creation includes the set of steps easy for execution in ConceptDraw PRO.Fishbone Diagram Problem Solving
The Ishikawa diagram, Cause and Effect diagram, Fishbone diagram — all they are the names of one and the same visual method for working with causal connections. Originally invented by Kaoru Ishikawa to control the process quality, the Ishikawa diagram is well proven in other fields of management and personal scheduling, events planning, time management. It is a chart in the form of a fish, whose head is a problem, the fins are variants for its causes.To design easily the Fishbone diagram, you can use a special ConceptDraw PRO vector graphic and diagramming software which contains the powerful tools for Fishbone diagram problem solving offered by Fishbone Diagrams solution for the Management area of ConceptDraw Solution Park.
 Management
This solution extends ConceptDraw PRO v9 and ConceptDraw MINDMAP v7 with Management Diagrams and Mind Maps (decision making, scheduling, thinking ideas, problem solving, business planning, company organizing, SWOT analysis, preparing and holding meetings
Fishbone Diagram Template
A causal model is an abstract concept, that describes the causal mechanisms of a system, by noting certain variables and their influence on each other, in an effort to discover the cause of a certain problem or flaw. This model is presented in diagram form by using a fishbone diagram.ConceptDraw PRO diagramming and vector drawing software enhanced with Fishbone Diagrams solution helps you create business productivity diagrams from Fishbone diagram templates and examples, that provide to start using of the graphic method for the analysis of problem causes. Each predesigned Fishbone Diagram template is ready to use and useful for instantly drawing your own Fishbone Diagram.
Preventive Action
Preventive Action - ConceptDraw Office suite is a software for the Preventive Action making. The Seven Management and Planning Tools solution is a set of such tools for problems preventive actions via investigating of the core problem.Skilled use of these diagrams makes collaborative teamwork both more engaging and more effective.

Bar Diagrams for Problem Solving. Create manufacturing and economics bar charts with Bar Graphs Solution
Create bar charts for visualizing problem solving in manufacturing and economics using the ConceptDraw PRO diagramming and vector drawing software extended with the Bar Graphs Solution from the Graphs and Charts area of ConceptDraw Solition Park.- Service 8 Ps fishbone diagram - Template | Business Productivity ...
- Service 8 Ps fishbone diagram - Template | Management | Service ...
- Service 8 Ps fishbone diagram - Template | Fishbone Diagram 6 P S
- Service 8 Ps fishbone diagram - Template | Business Productivity ...
- Fishbone Diagram | Service 8 Ps fishbone diagram - Template ...
- Service 8 Ps fishbone diagram - Template | Management | Quality ...
- Service 4 Ss fishbone diagram - Template | Service 8 Ps fishbone ...
- Using Fishbone Diagrams for Problem Solving | Business ...
- Fishbone Diagram | Fishbone Diagrams | Service 8 Ps fishbone ...
- Cause and Effect Analysis ( Fishbone Diagrams) | Using Fishbone ...
- Service 8 Ps fishbone diagram - Template | Fishbone Diagram | Bar ...
- Service 8 Ps fishbone diagram - Template | Fishbone Diagram ...
- Manufacturing 8 Ms fishbone diagram - Template | Business ...
- Service 8 Ps fishbone diagram - Template | Accounting Flowcharts ...
- Manufacturing 8 Ms fishbone diagram - Template | Business ...
- Fishbone Diagram | Business Productivity Diagramming | Service 8 ...
- Block diagram - Gap model of service quality | Process Flowchart ...
- Service 4 Ss fishbone diagram - Template | Fishbone Diagram ...
- Business Productivity Diagramming | Manufacturing 8 Ms fishbone ...
- Fishbone Diagram | Manufacturing 8 Ms fishbone diagram ...


