This site uses cookies. By continuing to browse the ConceptDraw site you are agreeing to our Use of Site Cookies.

Organigrams with ConceptDraw DIAGRAM

ConceptDraw - Organigram software allows quickly create Organigrams and much more. ConceptDraw DIAGRAM is an ideal tool for Administrative staff to clearly demonstrate the company orgchart professional.

Organization Structure

An organization structure reflects the composition and hierarchy of an organization, determines the distribution of authorities and responsibilities. ConceptDraw DIAGRAM diagramming and vector drawing software extended with 25 Typical Orgcharts solution from the Management area of ConceptDraw Solution Park allows effectively represent the organization structure of the company in the form of Organizational Chart.

Examples of Flowcharts, Org Charts and More

ConceptDraw DIAGRAM covers a broad spectrum of business graphics categories and offers at ConceptDraw STORE enormous online collection of pictorial examples and samples for different thematics and application areas. It is a plentiful source of inspiration and wonderful examples of professionally designed diagrams, flowcharts, UML diagrams, organizational charts, databases, ERDs, network diagrams, business charts, different thematic charts, schematics, infographics and plans developed specially for knowledge workers, engineers, managers, businessmen, marketing specialists, analytics, scientists, students, professors, journalists and also for a large number of other people that every day use various diagrams and drawings in their work and life activity. Each of these examples is a real art, all they are well thought-out and designed without efforts with help of powerful tools of ConceptDraw DIAGRAM software. ConceptDraw examples display all variety of tasks, possibilities and results that ConceptDraw Product Line lets achieve fast and easy. ConceptDraw is one of the best Visio alternatives for Mac. It open all Visio formats like.vsdx,.vss,.vdx files and allows you to export files to Visio formats.
What is ConceptDraw OFFICE

Marketing and Sales Organization chart. Organization chart Example

The use of Organization Charts is very popular at the fields of marketing and sales. They help to depict in a visual form a lot of information about organization: the company's structure, relationships of positions within an organization in terms of authorities and responsibilities, and company's strategies. All Organizational Charts are constructed from the similar building blocks (rectangles and lines), this makes them easily for interpretation and understanding by all interested people inside and outside of this company, such as shareholders, employees, investors, distributors, suppliers, customers, etc. Organization Charts can be hand-drawn on the paper, however the preferable is to use a special software. ConceptDraw DIAGRAM diagramming and vector graphics software extended with useful Organizational Charts solution is ideal for easy representing information and data, and professional drawing Marketing and Sales Organization Chart with any depth of detailing. Organizational structure may differ during the company's development, you can design and compare the charts on each stage.

Functional Organizational Structure

A functional organizational structure is a structure that consists of activities such as coordination, supervision and task allocation. You want to draw a functional organizational structure and look for the helpful software for this? Pay attention for the ConceptDraw DIAGRAM software! Extended with Organizational Charts Solution from the Management Area, it is ideal for functional organizational structure development.

Selecting & Creating Flowcharts

ConceptDraw Flowcharts visualize a process or algorithm of program as step/operation blocks of various shapes connected with arrowed lines showed the process flow direction. They are used to visualize business or technical processes and software algorithms.

Best Program to Create a Fowchart

ConceptDraw - feature-rich flowchart software allows you create professional looking flowcharts.

Flowchart on Bank. Flowchart Examples

This sample was created in ConceptDraw DIAGRAM diagramming and vector drawing software using the Flowcharts solution from the Diagrams area of ConceptDraw Solution Park. This sample shows the Flowchart of the Subprime Mortgage Crisis. This Flowchart describes the decline in housing prices when the housing bubble burst and what it caused on the housing and financial markets. You can also see the Government and Industry responses in this crisis situation.
Create Flowchart on Bank

UML Use Case Diagram Example. Registration System

This sample was created in ConceptDraw DIAGRAM diagramming and vector drawing software using the UML Use Case Diagram library of the Rapid UML Solution from the Software Development area of ConceptDraw Solution Park. This sample shows the types of user’s interactions with the system and is used at the registration and working with the database system.

Emergency Plan

The Fire Emergency Plan illustrates the scheme of the building and location of the main and fire exits for a safe evacuation, and clearly defines directions to them on the plan. Fire Emergency Plans are constructed on the case of unexpected or emergency situations, fires, hazardous leaks, natural disasters, and other sudden events. They must to be obligatorily on the plain sight at every building and on each floor, at living houses and apartments, schools and universities, medical centers, clinics and hospitals, office buildings, banks, cafes, restaurants, and also at all other public buildings and institutions. The Evacuation plans and Emergency Plans preliminary designed in ConceptDraw DIAGRAM software help employees and family members when some emergency events happen and let avoid the accidents and sad consequences, prevent injuries and fatalities, allow reduce damages and speed the work resumption. Start drawing emergency blueprint from floor bounds, then add the inner walls and doors, and finally use bright arrows to visually show evacuation directions to fire exits. ConceptDraw is a serious alternative to Visio. It's a desktop based solution aimed at professional designers working in CAD environments. It is also a good option for those who work between Mac and PC because one license is valid for both.
How to Draw a Floor Plan
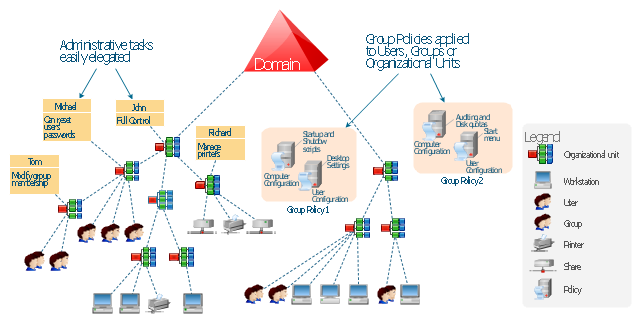
This example was drawn on the base of the Figure 2 illustrating the "Active Directory FAQ" from the website "Information Management Systems & Services" (IMSS) of the California Institute of Technology (Caltech) campus. [imss.caltech.edu/ node/ 412]
"By using the Active Directory® Domain Services (AD DS) server role, you can create a scalable, secure, and manageable infrastructure for user and resource management, and you can provide support for directory-enabled applications, such as Microsoft® Exchange Server. ...
AD DS provides a distributed database that stores and manages information about network resources and application-specific data from directory-enabled applications. Administrators can use AD DS to organize elements of a network, such as users, computers, and other devices, into a hierarchical containment structure. The hierarchical containment structure includes the Active Directory forest, domains in the forest, and organizational units (OUs) in each domain. A server that is running AD DS is called a domain controller." [technet.microsoft.com/ en-us/ library/ 9a5cba91-7153-4265-adda-c70df2321982]
The Active Directory Domain Services diagram example was created using the ConceptDraw PRO diagramming and vector drawing software extended with the Active Directory Diagrams solution from the Computer and Networks area of ConceptDraw Solution Park.
Active Directory hierarchical structure
Active Directory hierarchical structure, volume, print queue, policy, organizational unit, group, domain, computer,

ConceptDraw DIAGRAM The best Business Drawing Software

ConceptDraw DIAGRAM is new software for business and technical drawing. Powerful business drawing tools, extensive libraries with pre-drawn shapes, free samples of business drawings, technical drawings and flowcharts, support of many graphic formats enable users to visually develop their business drawings charts and diagrams in any combination of drawings, diagrams and flow charts.

Pie Chart Examples and Templates

A pie chart or a circle graph is a circular chart divided into sectors, illustrating numerical proportion. In a pie chart, the arc length of each sector and consequently its central angle and area, is proportional to the quantity it represents. Pie chart examples and templates created using ConceptDraw DIAGRAM software helps you get closer with pie charts and find pie chart examples suite your needs.