Basic Diagramming
Mathematics is an exact science, which studies the values, spatial forms and quantitative relations. It is a science, in which is built large number of various diagrams, charts and graphs that present the material in a clear, visual and colorful form, help to analyze the information and to make certain conclusions. A diagram is a graphical representation of data using the linear segments or geometric shapes, which allows to evaluate the ratio of several values. Depending on the types of solved tasks are used the diagrams of different kinds. A graph is a diagram that shows quantitative dependencies of various processes using the curves. ConceptDraw DIAGRAM is a powerful intelligent and multifunctional vector engine for drawing different Mathematical diagrams and graphs, Mathematical illustrations, complex and simple Diagram mathematics, Flowcharts of equation solving process, Line graphs, Scatter plots, Histograms, Block diagrams, Bar charts, Divided bar diagrams, Pie charts, Area charts, Circular arrows diagrams, Venn diagrams, Bubble diagrams, Concept maps, and many others.
Mathematical Diagrams
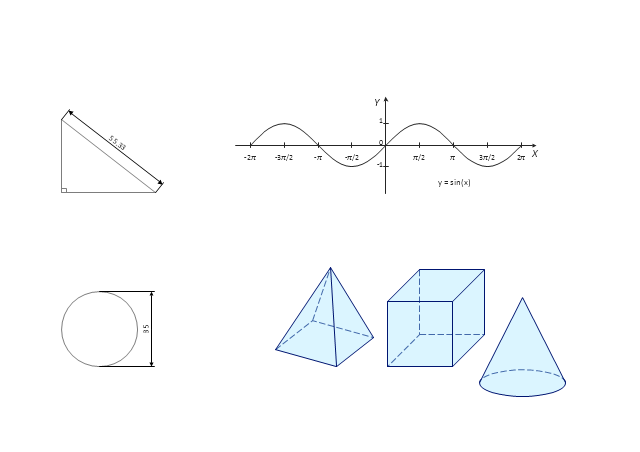
ConceptDraw DIAGRAM diagramming and vector drawing software extended with Mathematics solution from the Science and Education area is the best for creating: mathematical diagrams, graphics, tape diagrams various mathematical illustrations of any complexity quick and easy. Mathematics solution provides 3 libraries: Plane Geometry Library, Solid Geometry Library, Trigonometric Functions Library.Use this mathematical drawings and graphs template to create your own math illustrations using the shapes of plane and solid geometric figures as well as trigonometric functions.
"Mathematical visualization or mathematical visualization is an aspect of geometry which allows one to understand and explore mathematical phenomena via visualization. Classically this consisted of two-dimensional drawings or building three-dimensional models (particularly plaster models in the 19th and early 20th century), while today it most frequently consists of using computers to make static two or three dimensional drawings, animations, or interactive programs. Writing programs to visualize mathematics is an aspect of computational geometry." [Mathematical visualization. Wikipedia]
The math illustrations template for the ConceptDraw PRO diagramming and vector drawing software is included in the Mathematics solution from the Science and Education area of ConceptDraw Solution Park.
Mathematics Symbols
ConceptDraw DIAGRAM extended with Mathematics solution from the Science and Education area is a powerful diagramming and vector drawing software that offers all needed tools for mathematical diagrams designing. Mathematics solution provides 3 libraries with predesigned vector mathematics symbols and figures: Solid Geometry Library, Plane Geometry Library and Trigonometric Functions Library.Chemistry Equation Symbols
If you are related with chemistry in you work or education activity, you need often draw various illustrations with chemistry equations. ConceptDraw DIAGRAM diagramming and vector drawing software offers you the Chemistry solution from the Science and Education area. Chemistry solution provides the Chemical Drawings Library with large quantity of vector chemistry equation symbols to help you create professional looking chemistry diagrams quick and easy.Scientific Symbols Chart
ConceptDraw DIAGRAM is the beautiful design software that provides many vector stencils, examples and templates for drawing different types of illustrations and diagrams.Mathematics Solution from the Science and Education area of ConceptDraw Solution Park includes a few shape libraries of plane, solid geometric figures, trigonometrical functions and greek letters to help you create different professional looking mathematic illustrations for science and education.
Bar Diagram Math
ConceptDraw DIAGRAM extended with Divided Bar Diagrams solution from Graphs and Charts area of ConceptDraw Solution Park is the best software for quick and simple drawing the Divided Bar Diagrams and Bar Diagram Math.HelpDesk
How to Draw Geometric Shapes
Knowledge of geometry grants people good logic, abstract and spatial thinking skills. The object of study of geometry is the size, shape and position, the 2-dimensional and 3-dimensional shapes. Geometry is related to many other areas in math and is used daily by engineers, architects, designers, and many other professionals. Today, the objects of geometry are not only shapes and solids. It deals with properties and relationships and looks much more about analysis and reasoning. Geometry drawings can be helpful when you study geometry or need to illustrate some investigation related to geometry. ConceptDraw DIAGRAM allows you to draw plane and solid geometry shapes quickly and easily.Physics Symbols
ConceptDraw DIAGRAM diagramming and vector drawing software extended with Physics solution from the Science and Education area is a powerful software for creating various physics diagrams. Physics solution provides all tools that you can need for physics diagrams designing. It includes 3 libraries with predesigned vector physics symbols: Optics Library, Mechanics Library and Nuclear Physics Library.The Best Mac Software for Diagramming or Drawing
ConceptDraw DIAGRAM is a powerful intelligent vector graphics engine that can be used to create basic diagrams including flowcharts, charts, workflows, flowcharts, organizational charts, business diagram, learn business diagrams, flow diagrams.
Sun Solar System
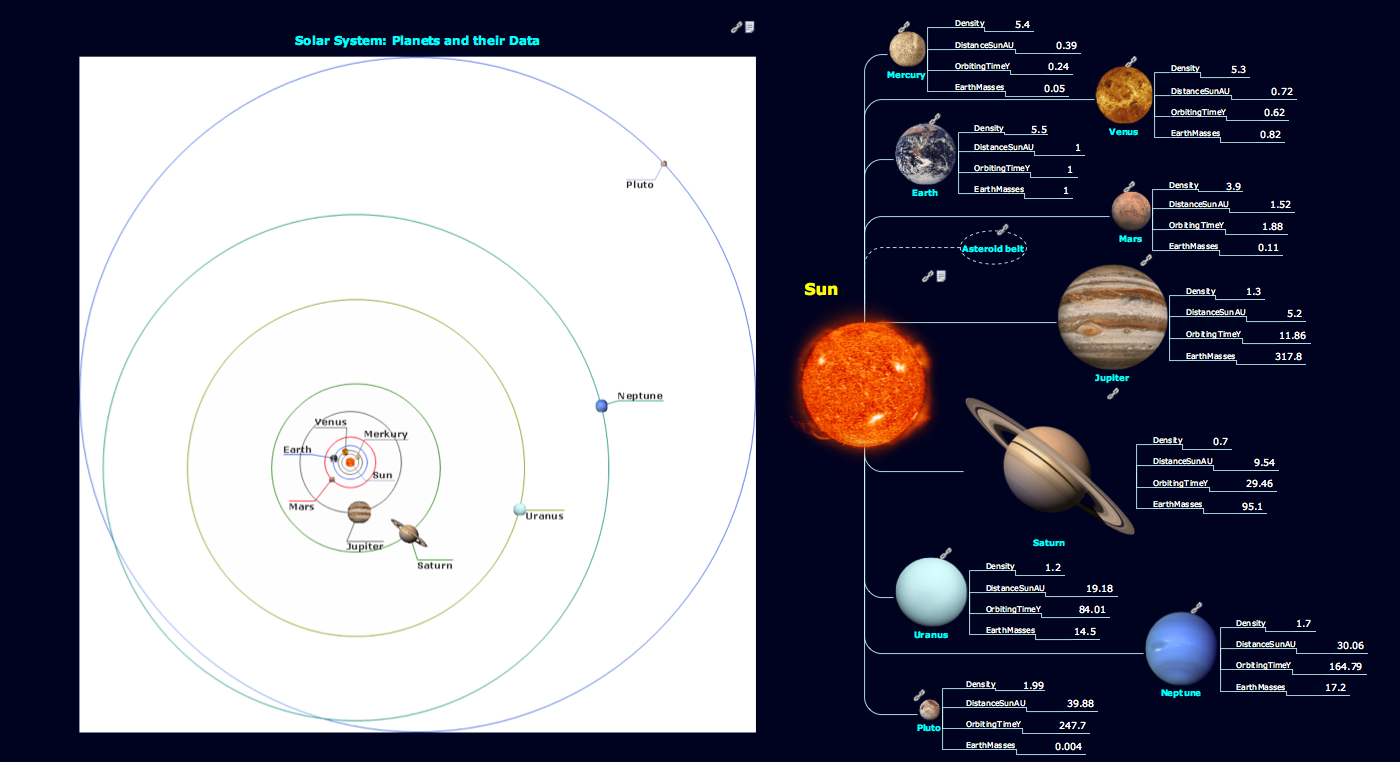
ConceptDraw DIAGRAM diagramming and vector drawing software offers the Astronomy solution with useful tools for drawing all kinds of astronomy pictures and sun solar system illustrations. The astronomy illustrations designed with ConceptDraw DIAGRAM are vector graphic documents and are available for reviewing, modifying, converting to a variety of formats (image, HTML, PDF file, MS PowerPoint Presentation, Adobe Flash or MS Visio XML), printing and send via e-mail in one moment.Basic Diagramming
Create flowcharts, organizational charts, bar charts, line graphs, and more with ConceptDraw DIAGRAM.
The Building Blocks Used in EPC Diagrams
Event-Driven Process Chain Diagrams is using for improvement throughout an organisation. ConceptDraw DIAGRAM - software that reduces the time needed to create a EPC diagrams.How To Create Floor Plans
The use of professional drawing floor plan software is always convenient for all building-related people, primarily for architects and designers. It lets design precise building plans, easy perceived and understandable for all colleagues, clients, and also builders. ConceptDraw DIAGRAM floor plan software is especially useful for quick and easy drawing great-looking designs, floor plans, building plans, layout plans, etc. Thanks to the Floor Plans solution from the Building Plans area of ConceptDraw Solution Park you don't need to be professional artist for drawing. This solution offers a lot of helpful examples and samples of House floor plans, Office floor plans, Salon floor plans, helpful for your independent drawing similar diagrams. Numerous libraries with large quantity of predesigned vector objects included to the Floor Plans solution perfectly suit for creation Architectural house plans, Storage building plans, Commercial building plans, Pole building plans, Blueprints for facilities management, Office space planning and many more without any efforts.
- Software For Drawing Mathematical Diagrams
- Math illustrations - Template | Mathematical Diagrams | Scientific ...
- Mathematics | Mathematics Symbols | Mathematical Diagrams ...
- Basic Diagramming | Mathematics | Euclidean algorithm - Flowchart ...
- Mathematical Diagrams | Mathematics Symbols | Math illustrations ...
- Mathematics Drawing
- Mathematics | Basic Diagramming | Best Multi-Platform Diagram ...
- Mathematical Drawing Software
- Mathematical Formulas Using The Flowchart
- Solving quadratic equation algorithm - Flowchart | Mathematics ...
- Mathematical Diagrams | Scientific Symbols Chart | How to Draw ...
- Mathematics Symbols | Mathematical Diagrams | Basic ...
- Mathematical Diagrams | Basic Diagramming | Mathematics ...
- Illustration Software | Biology Illustration | Drawing Illustration | The ...
- Drawing Software Equation
- Mathematics Symbols | Chemistry Equation Symbols | Basic ...
- Basic Diagramming | Mathematics Symbols | Bar Diagram Math ...
- Mathematics Symbols | Mathematical Diagrams | Basic Flowchart ...
- Mathematics | Basic Diagramming | Mathematics Symbols ...
- Bar Diagram Math | Math illustrations - Template | Basic ...


