Ice Hockey Positions Diagram
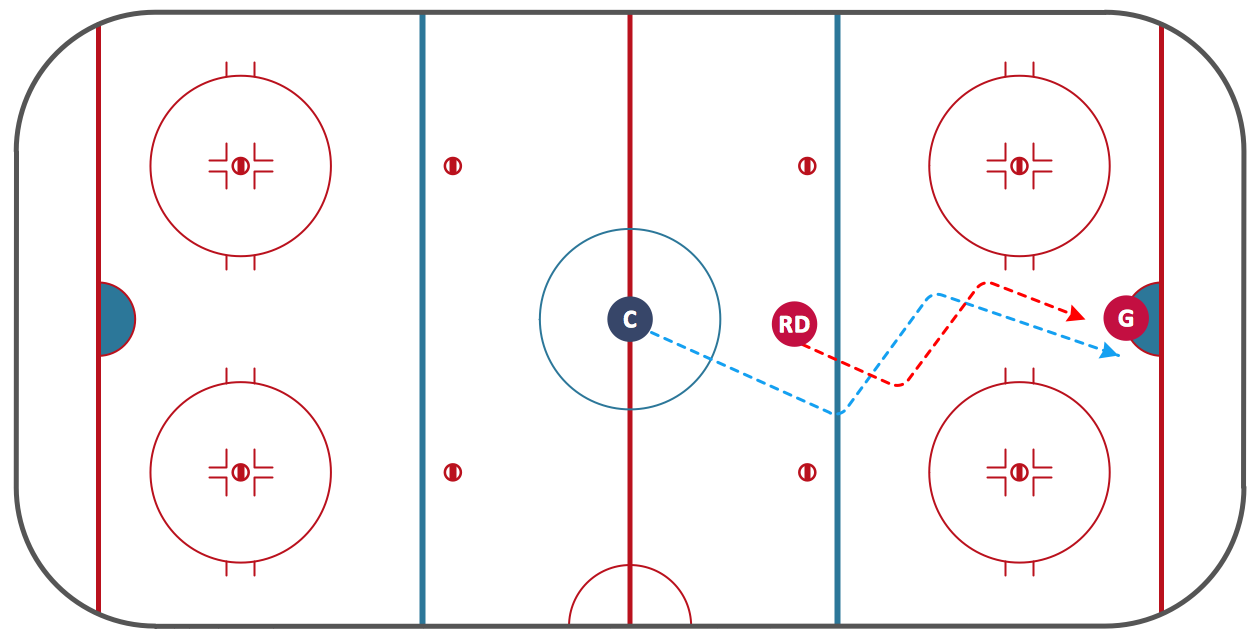
ConceptDraw Ice Hockey Solution for ConceptDraw DIAGRAM delivers the "Ice Hockey Positions" library that contains predesigned objects for all ice hockey positions. A set of templates and samples demonstrates best practice of using this library.Ice Hockey Diagram – Deke Technique
Explaining ice hockey techniques becomes much more easier and time saving with illustrations. The Ice Hockey solution for ConceptDraw DIAGRAM is designed as a tool that helps produce ice hockey illustrations of any complexity in minutes.Ice Hockey Diagram – Penalty Kill Forecheck Angling Drill
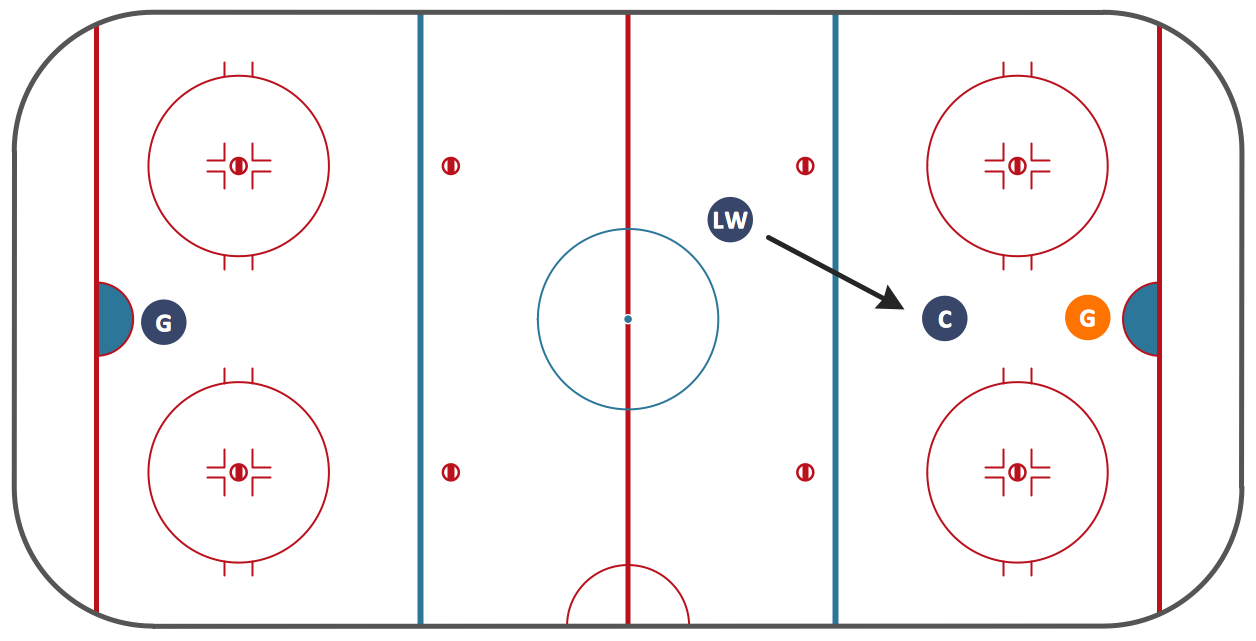
ConceptDraw Ice Hockey solution is a good tool to think about complex things. You don't need a software during hockey match, of course. Drawing software helps to plan strategy and tactics before a match, and then analyze mistakes and results.Ice Hockey Offside Diagram
"Offsides" is a very basic sports term, which can be very hard to explain to a novice. The fundamental concepts in sports can be extremely difficult to convey without a drawing, that's why we included an Offsides Sample in the Hockey solution. Explaining with ConceptDraw in your playbook is easier than ever before!Ice Hockey Rink Dimensions
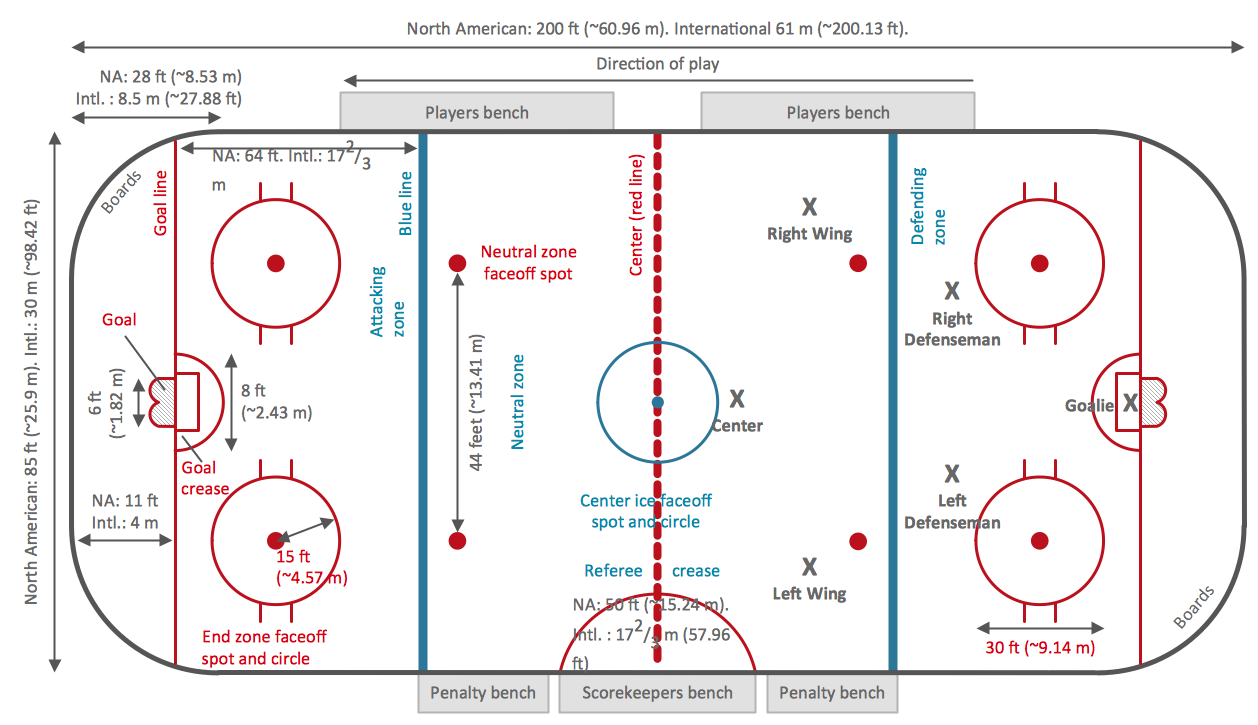
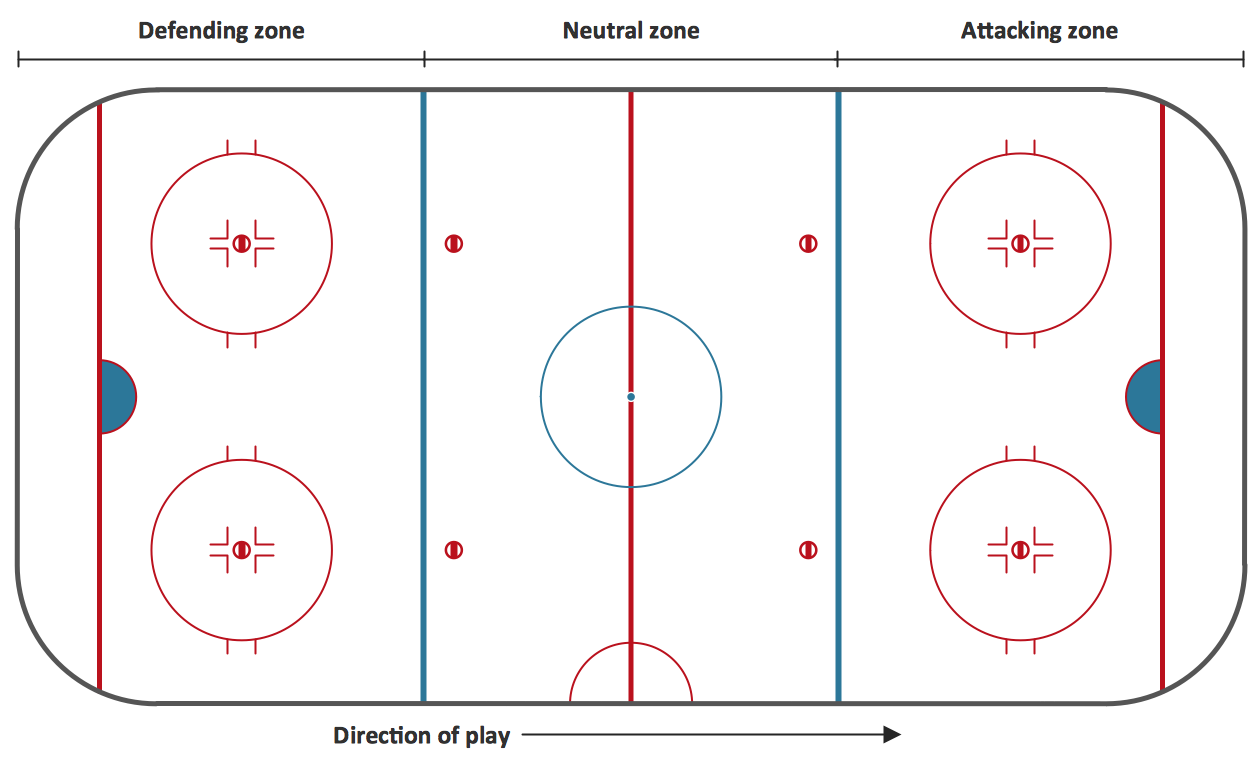
Meeting ice hockey rules one should learn ice hockey rink terms, lines, zones etc. ConceptDraw DIAGRAM is an advanced drawing software that allows you produce ice hockey rink depiction of any complexity, from simple sketch drawing to detailed one as on example below.Ice Hockey Diagram — Defensive Strategy — Neutral Zone Trap
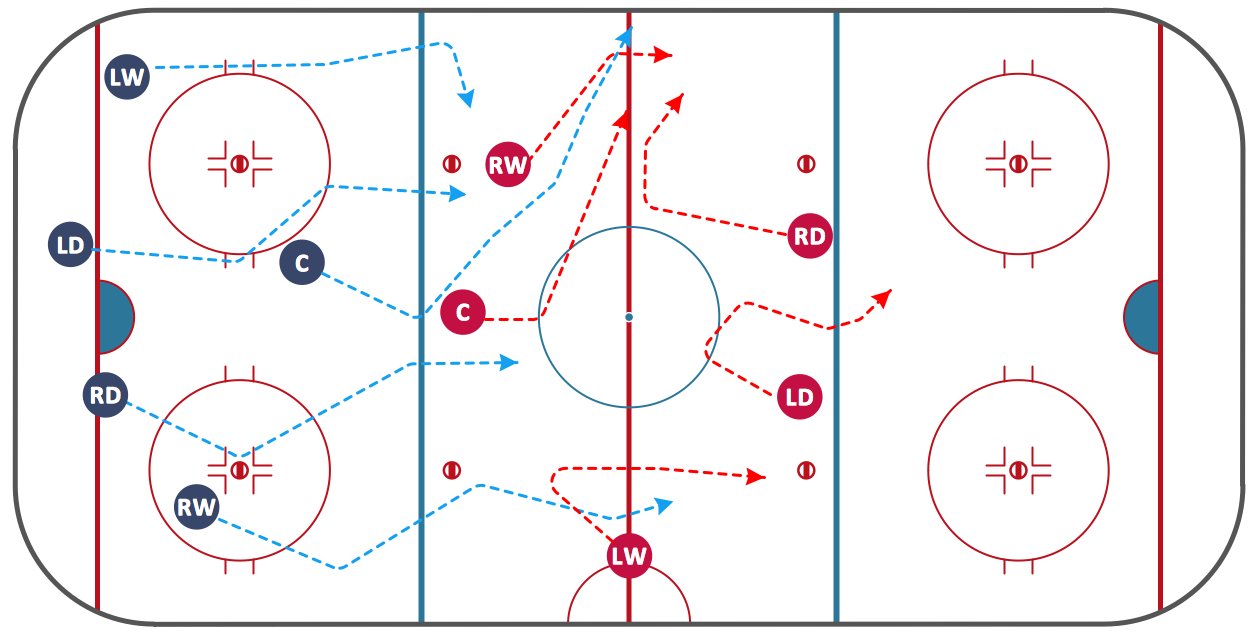
In ConceptDraw DIAGRAM you can produce ice hockey diagrams of any complexity for any presentaion needs, using a combination of tools. To adopt the sample below for presentation needs place positions and arrows onto different layers of your document and then make them visible one by one during a presentation.Ice Hockey Rink Diagram
The main advantage of using ConceptDraw Ice Hockey Solution is that you don't need to draw objects manually, you have all you need in libraries, templates and samples. This allows you produce professional ice hockey diagrams as quickly as possible, and then post them to blog or social media, print or present on a large screen.Basketball Court Diagram and Basketball Positions
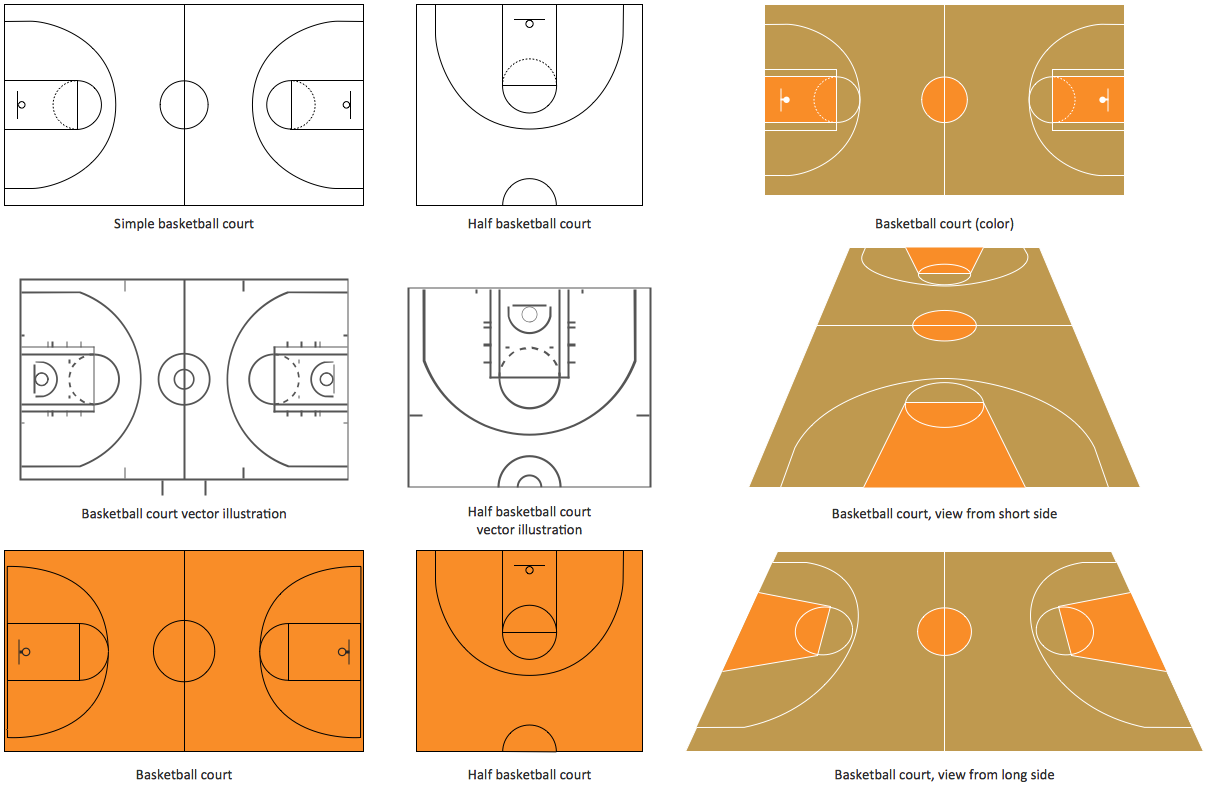
The illustration of possible situations during the basketball matches, presentation of basketball positions and the best tactics, explanation of rules and training to successful game, become much more easier and time saving with visual illustrations and drawings. Creation of several illustrations and comparing them lets effectively show the differences and advantages in positions of players. ConceptDraw DIAGRAM software extended with Basketball solution from Sport area of ConceptDraw Solution Park provides the shapes' libraries with different kinds of basketball courts and basketball positions, templates and samples, which will render great help for basketball specialists and fans in drawing professional-looking and illustrative basketball-related diagrams and schematics of any complexity in a few minutes. Extensive export capabilities of ConceptDraw DIAGRAM to varied graphical formats open before you wide field for activities and possibility to easy communicate with large quantity of people, which have different software installed on their devices.Soccer (Football) Positions
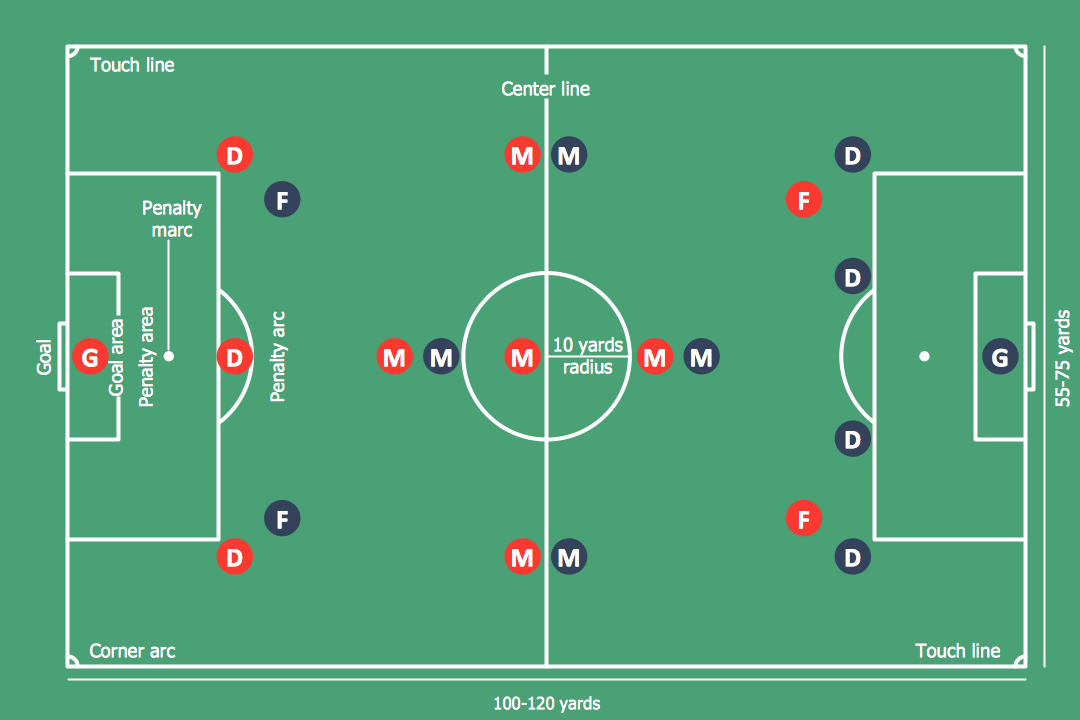
Explaining soccer positions becomes much more easier and time saving with visual drawings. ConceptDraw DIAGRAM software extended with the Soccer solution from the Sport area of ConceptDraw Solution Park is very useful tool that will help you design the soccer-related drawings of any complexity in minutes.Baseball Diagram — Baseball Field — Corner View — Sample
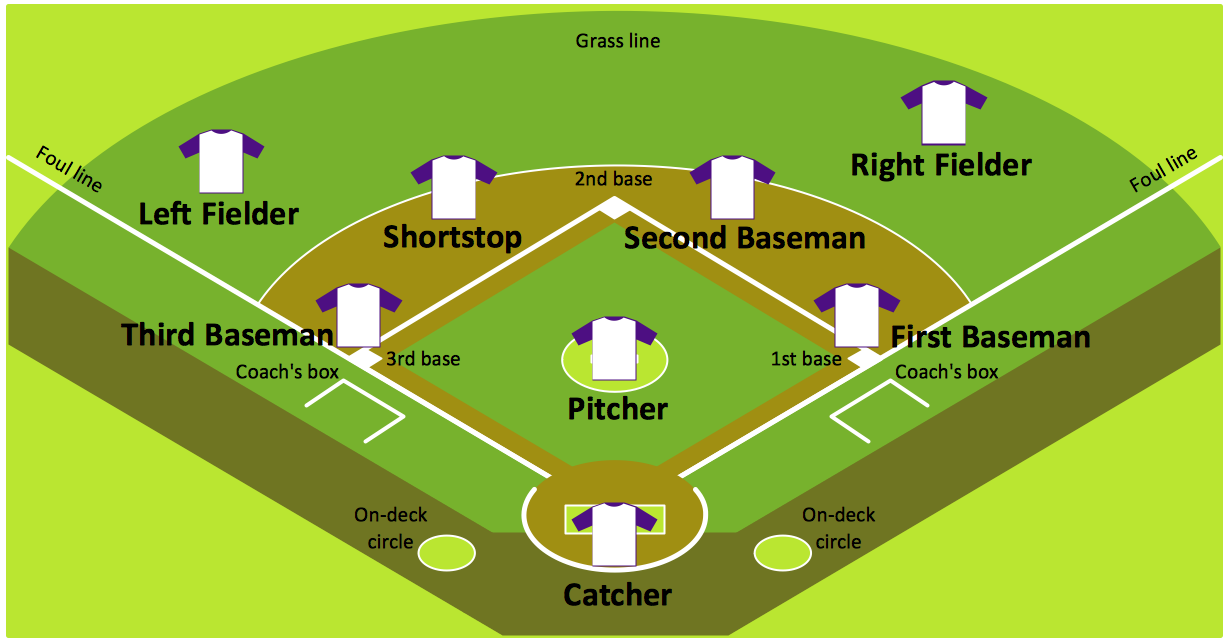
Explaining basics of Baseball is practically impossible without drawing a diagram. If you need to do this more than once you have to choose an appropriate tool allows you to change diagrams easily. ConceptDraw DIAGRAM extended with the Baseball Solution is the best choice for this case.
 Fishbone Diagram
Fishbone Diagrams solution extends ConceptDraw DIAGRAM software with templates, samples and library of vector stencils for drawing the Ishikawa diagrams for cause and effect analysis.
Entity Relationship Diagram Examples
Creation of Entity-Relationship (ER) model is a visual representation the structure of a business database, where data equates to entities or objects, which are linked by defined relationships expressing dependencies and requirements. By the nature, the ER model is an abstract visualization, a first step in design process towards creating a logical and functional database. ConceptDraw DIAGRAM professional software gives the ability to effectively describe a database using the Entity-Relationship model. Included to ConceptDraw Solution Park, the Entity-Relationship Diagram (ERD) solution contains the set of predesigned vector icons advocated by Chen's and Crow’s Foot notations that both can be used for data modeling and describing a database. Entity-Relationship Diagram (ERD) solution includes also helpful templates and incredibly large collection of varied Entity Relationship Diagram examples and samples offered at ConceptDraw STORE. Each of them can be used to develop your own model of a database of arbitrary complexity.
ERD Symbols and Meanings
Entity Relationship Diagram (ERD) is a popular software engineering tool for database modeling and illustration the logical structure of databases, which uses one of two notations - Chen's or Crow’s Foot. Crow's foot notation is effective when used in software engineering, information engineering, structured systems analysis and design. Each of these notations applies its own set of ERD symbols. Crow's foot diagrams use boxes to represent entities and lines between these boxes to show relationships. Varied shapes at the ends of lines depict the cardinality of a given relationship. Chen's ERD notation is more detailed way to represent entities and relationships. ConceptDraw DIAGRAM application enhanced with all-inclusive Entity-Relationship Diagram (ERD) solution allows design professional ER diagrams with Chen's or Crow’s Foot notation on your choice. It contains the full set of ready-to-use standardized ERD symbols and meanings helpful for quickly drawing, collection of predesigned ERD samples, examples and templates. ConceptDraw Pro is a great alternative to Visio for Mac users as it offers more features and can easily handle the most demanding professional needs.
Basketball Plays Software
Basketball is a popular sport played by two teams of five players with a ball. The game takes place on a rectangular court. The team goal is to score a ball into the basket of the opponent team. The team with the most points wins the game. ConceptDraw DIAGRAM diagramming and vector drawing software extended with Basketball solution from the Sport area of ConceptDraw Solution Park is a very useful tool for designing the basketball-related diagrams of any complexity.Soccer (Football) Dimensions
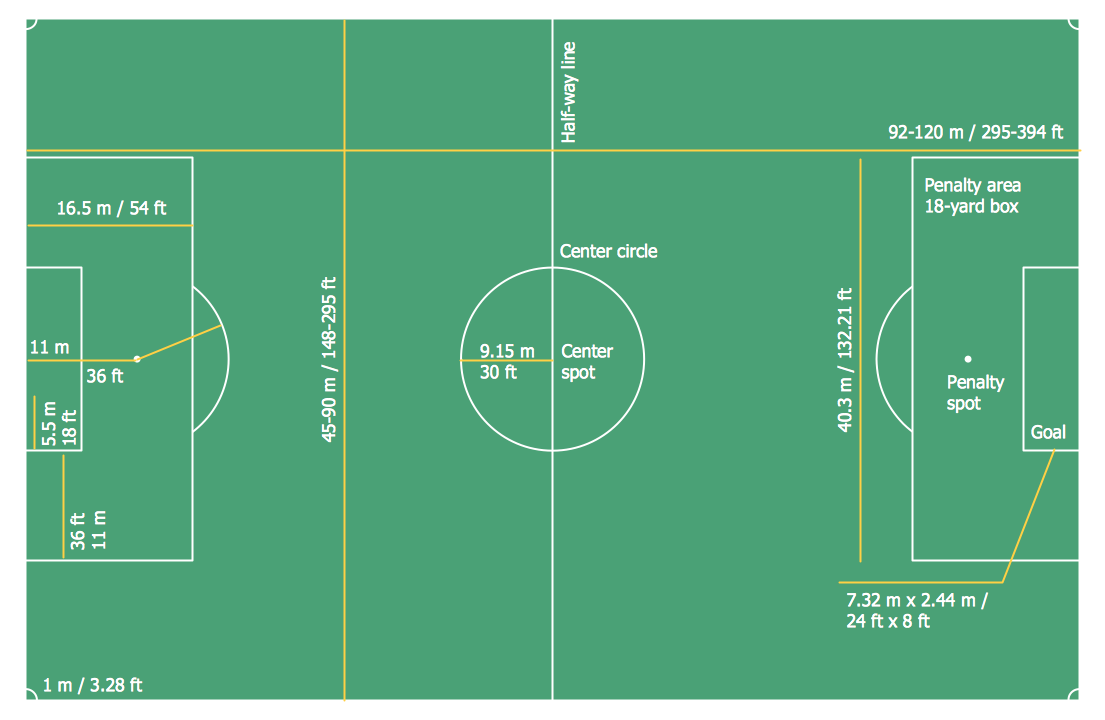
The Soccer solution from the Sport area of ConceptDraw Solution Park is designed as a tool that helps produce soccer illustrations of any complexity in minutes. You can quick and easy design the professional looking plan of the soccer field with set up dimensions.- Diagram Of A Hockey Pitch And Labelled
- Draw A Well Labelled Diagram Of A Hockey Field With Their
- Ice Hockey Diagram – Deke Technique | A Well Drawn And Labeled ...
- Diagram Of A Standard And Well Labelled Hockey Pitch
- Diagram Of Hockey Court And Labelled
- Word Exchange | Hockey Stick Diagram And Well Labelled
- A Well Labelled Diagram Of A Hockey Pitch
- Word Exchange | A Diagram Of A Labelled Hockey Stick
- Draw And Label A Hockey Pitch
- Diagramm Of A Well Labelled Hockey Pitch
- Well Label Diagram Of Hockey Stick
- Draw A Well Labelled Diagram Of A Hockey Field In Their Standard
- Draw And Label A Well Standard Hockey Pitch
- Diagram And Well Labelled Of Hockey Field And Stick
- A Well Leabelled Diagram Of A Hockey Pitch
- Diagram Of Hockey Field And Label
- Soccer (Football) Positions | Ice Hockey Rink Diagram | Soccer ...
- Draw And Label A Standard Hockey Field
- Diagram Of Hockey Stick And Label
- Labeled Diagram Of A Hockey Pitch

