Basic Flowchart Symbols and Meaning
Flowcharts are the best for visually representation the business processes and the flow of a custom-order process through various departments within an organization. ConceptDraw PRO diagramming and vector drawing software extended with Flowcharts solution offers the full set of predesigned basic flowchart symbols which are gathered at two libraries: Flowchart and Flowcharts Rapid Draw. Among them are: process, terminator, decision, data, document, display, manual loop, and many other specific symbols. The meaning for each symbol offered by ConceptDraw gives the presentation about their proposed use in professional Flowcharts for business and technical processes, software algorithms, well-developed structures of web sites, Workflow diagrams, Process flow diagram and correlation in developing on-line instructional projects or business process system. Use of ready flow chart symbols in diagrams is incredibly useful - you need simply drag desired from the libraries to your document and arrange them in required order. There are a few serious alternatives to Visio for Mac, one of them is ConceptDraw PRO. It is one of the main contender with the most similar features and capabilities.
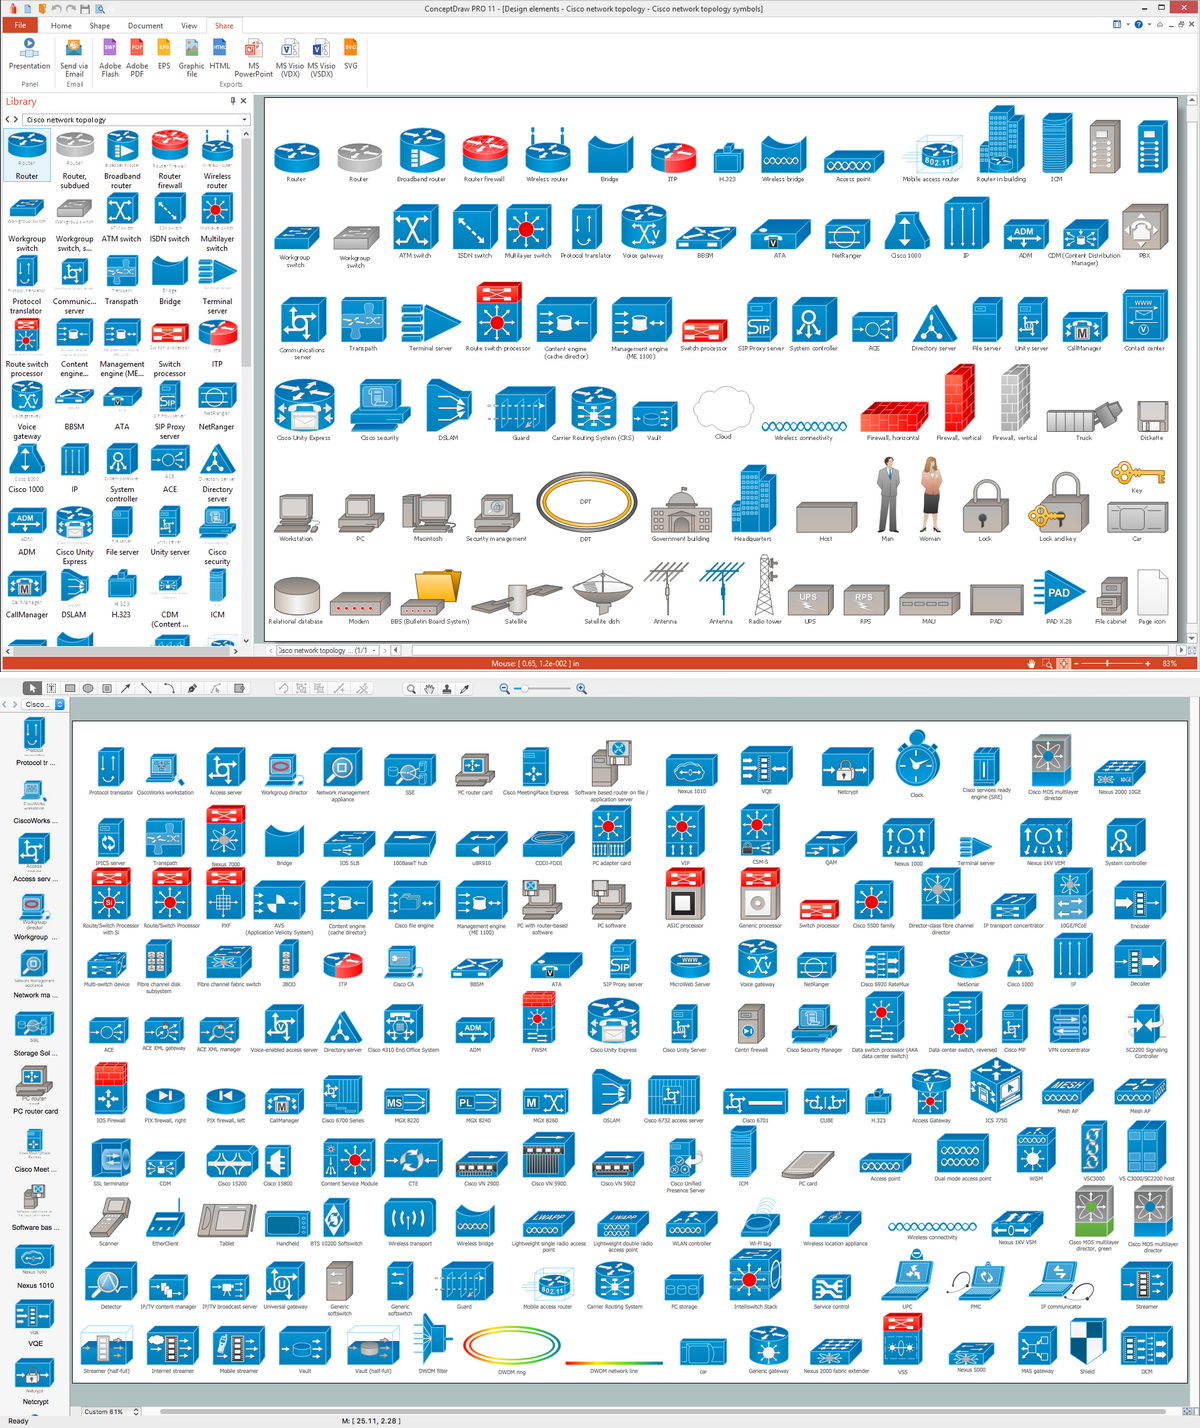
Cisco Network Topology. Cisco icons, shapes, stencils and symbols
Cisco Network Topology represents the arrangement of worldwide recognized and standardized Cisco network symbols, icons, shapes, and stencils which help visualize the schemes of computer networks. Any equipment used in Cisco networks is also named a node and network topology diagram represents the scheme of connection the used nodes. Cisco Network Diagram illustrates how the signals enter on the networked devices and how the data spread within a network from one device to another. These diagrams are useful for engineers while constructing computer networks and working with them. Cisco Network Diagrams solution included to Computer and Networks area of ConceptDraw Solution Park contains quick-start templates, professionally designed samples and examples, and numerous libraries with a lot of predesigned vector design elements, icons, and shapes of Cisco equipment, components, devices, links which provide for ConceptDraw PRO users a perfect possibility of simple and quick drawing Cisco Network Diagrams and Schematics, Network Designs and Maps of any complexity.Local area network (LAN). Computer and Network Examples
Local Area Network (LAN) is a network which consists of computers and peripheral devices connected each other and to the local domain server, and covers a little territory or small number of buildings, such as home, school, laboratory, office, etc. LAN serves for few hundreds of users. It includes many cables and wires, and demands to design previously a Network diagram. All local area network devices can use the shared printers and disk storage. ConceptDraw PRO is a perfect network diagramming software with examples of LAN Diagrams, templates and predesigned vector objects. ConceptDraw PRO is the ideal choice for network engineers and network designers who need to draw fast and easy Local Area Network Diagrams, for IT specialists, developers and other IT professionals which need to visualize the communication schemes of LAN and visually document the LAN's physical structure and arrangement in houses, offices and other buildings. Ready-to-use vector objects from Computer Network Diagrams solution will help you design LAN diagrams in minutes.
ERD Symbols and Meanings
Entity Relationship Diagram (ERD) is a popular software engineering tool for database modeling and illustration the logical structure of databases, which uses one of two notations - Chen's or Crow’s Foot. Crow's foot notation is effective when used in software engineering, information engineering, structured systems analysis and design. Each of these notations applies its own set of ERD symbols. Crow's foot diagrams use boxes to represent entities and lines between these boxes to show relationships. Varied shapes at the ends of lines depict the cardinality of a given relationship. Chen's ERD notation is more detailed way to represent entities and relationships. ConceptDraw PRO application enhanced with all-inclusive Entity-Relationship Diagram (ERD) solution allows design professional ER diagrams with Chen's or Crow’s Foot notation on your choice. It contains the full set of ready-to-use standardized ERD symbols and meanings helpful for quickly drawing, collection of predesigned ERD samples, examples and templates. ConceptDraw Pro is a great alternative to Visio for Mac users as it offers more features and can easily handle the most demanding professional needs.
 Mathematics
Mathematics solution extends ConceptDraw PRO software with templates, samples and libraries of vector stencils for drawing the mathematical illustrations, diagrams and charts.
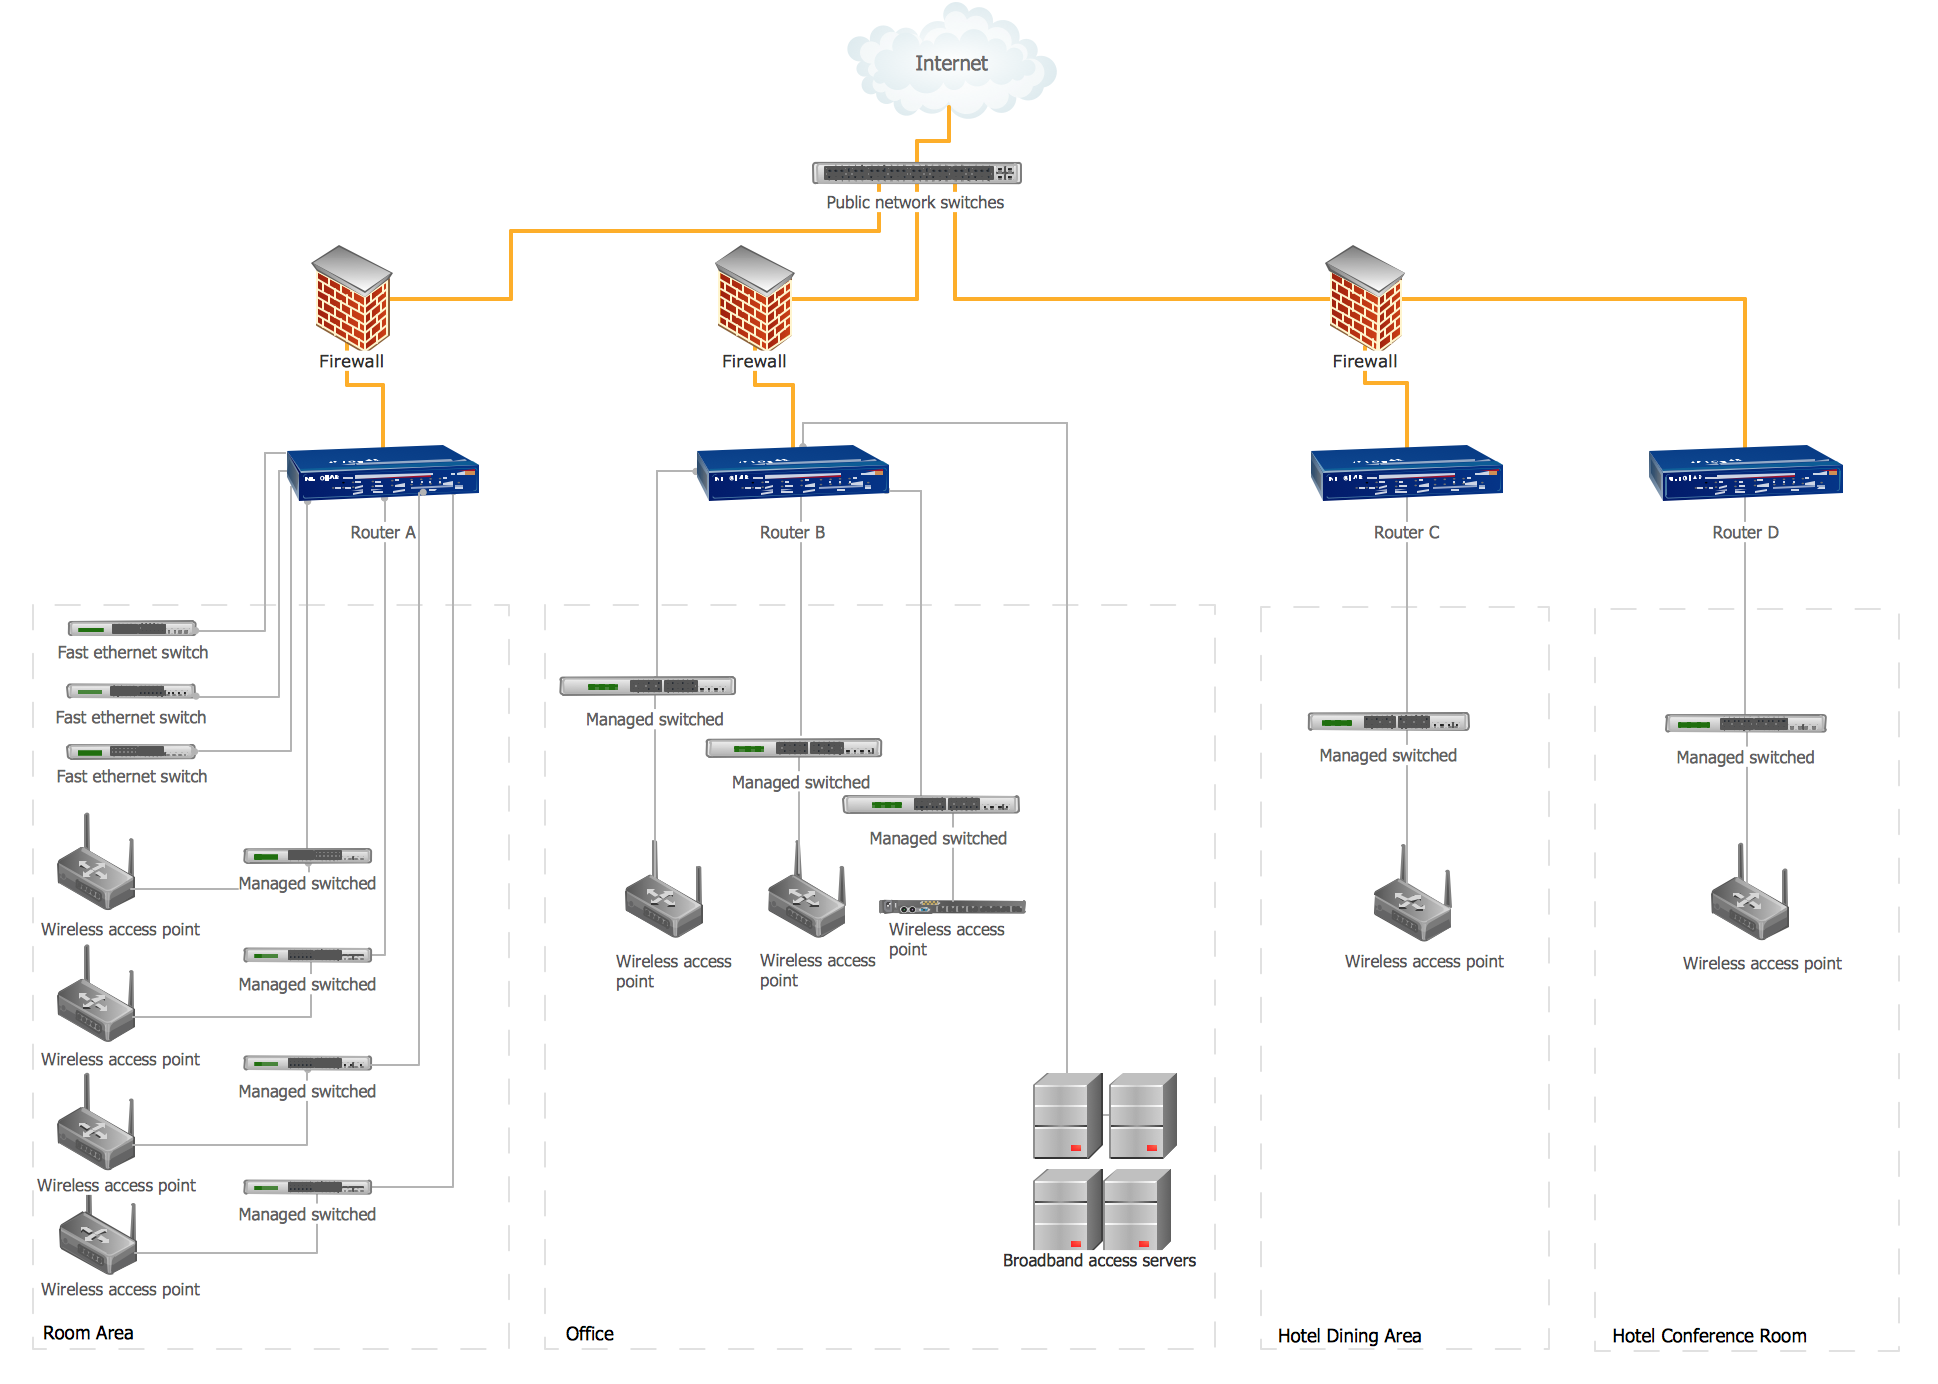
Hotel Network Topology Diagram
Network topology is a layout of various elements of computer network, such as nodes, links, routers, etc. It is a network topological structure which can be depicted logically or physically. Physical topology shows the physical location of network's components and cable connections between network nodes. Logical topology describes the data flows, the circulation of signals in physical topology. The physical and logical topologies for two networks can be identical, while their physical interconnections, the distances between nodes, transmission rates, and/or signal types may be differ. ConceptDraw PRO with Computer and Networks solution from Computer and Networks area of ConceptDraw Solution Park lets you design physical and logical network topology diagrams for wireless and wired computer communication networks located in various premises, including the hotels. You can easy design Hotel Network Topology Diagram, diagrams depicted LANs and WLANs, and also any of eight basic topologies (Point-to-point, Star, Bus, Mesh, Ring, Tree, Hybrid, Daisy chain).
Process Flowchart
The main reason of using Process Flowchart or PFD is to show relations between major parts of the system. Process Flowcharts are used in process engineering and chemical industry where there is a requirement of depicting relationships between major components only and not include minor parts. Process Flowcharts for single unit or multiple units differ in their structure and implementation. ConceptDraw PRO is Professional business process mapping software for making Process flowcharts, Process flow diagram, Workflow diagram, flowcharts and technical illustrations for business documents and also comprehensive visio for mac application. Easier define and document basic work and data flows, financial, production and quality management processes to increase efficiency of your business with ConcepDraw PRO. Business process mapping software with Flowchart Maker ConceptDraw PRO includes extensive drawing tools, rich examples and templates, process flowchart symbols and shape libraries, smart connectors that allow you create the flowcharts of complex processes, process flow diagrams, procedures and information exchange. Process Flowchart Solution is project management workflow tools which is part ConceptDraw Project marketing project management software. Drawing charts, diagrams, and network layouts has long been the monopoly of Microsoft Visio, making Mac users to struggle when needing such visio alternative like visio for mac, it requires only to view features, make a minor edit to, or print a diagram or chart. Thankfully to MS Visio alternative like ConceptDraw PRO software, this is cross-platform charting and business process management tool, now visio alternative for making sort of visio diagram is not a problem anymore however many people still name it business process visio tools.
Organic Chemistry Symbols
ConceptDraw PRO diagramming and vector drawing software extended with Chemistry solution from the Science and Education area of ConceptDraw Solution Park is effective for drawing various organic chemistry schemes, diagrams, illustrations thanks to the included collection of predesigned organic chemistry symbols.Exam Preparation Mind Map
Mind Map is a way to effectively visualize the complex knowledge, to simplify and accelerate the learning and teaching processes. In this way Mind Maps are always in demand in a lot of spheres, among them business, education, engineering, software development, and many others. Mind Maps are perfect for illustration the documents, reports, textbooks, websites, education materials, lectures, etc. The ConceptDraw MINDMAP professional software from ConceptDraw Office suite provides a lot of powerful tools for brainstorming and designing colorful and attractive Mind Maps, drawings and charts, which ideally suit for structuring information and its representation in a visual and comprehensive form. To prepare effectively for examination, you need organize yourself and also clearly understand the correct sequence of actions. This Mind Map created in ConceptDraw MINDMAP application illustrates the main items during the exam preparation process. The use of predesigned cliparts lets to make your Mind Maps illustrative, colorful and attractive.Cisco Security. Cisco icons, shapes, stencils and symbols
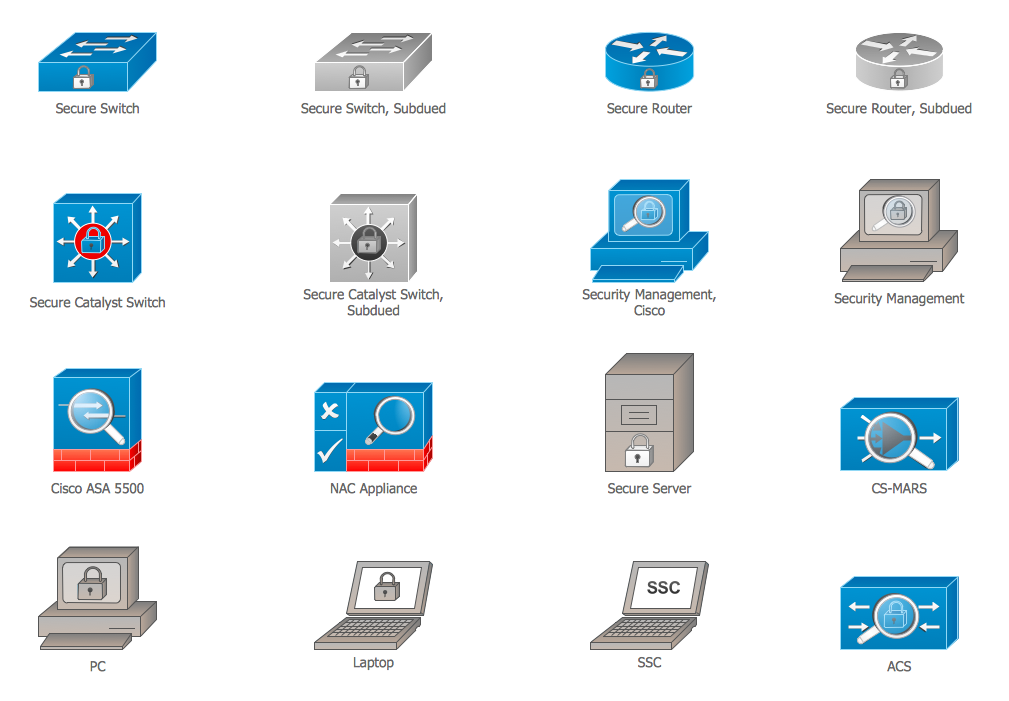
The ConceptDraw vector stencils library "Cisco Security" contains 16 symbols of security devices and equipment for drawing the computer network diagrams using the ConceptDraw PRO diagramming and vector drawing software.Biology Symbols
ConceptDraw PRO diagramming and vector drawing software extended with Biology solution from the Science and Education area offers a set of useful tools for fast and easy drawing of various biology illustrations and drawings.Biology solution provides 3 libraries with large quantity of vector biology symbols: Biochemistry of Metabolism Library, Carbohydrate Metabolism Library, Citric Acid Cycle (TCA Cycle) Library.
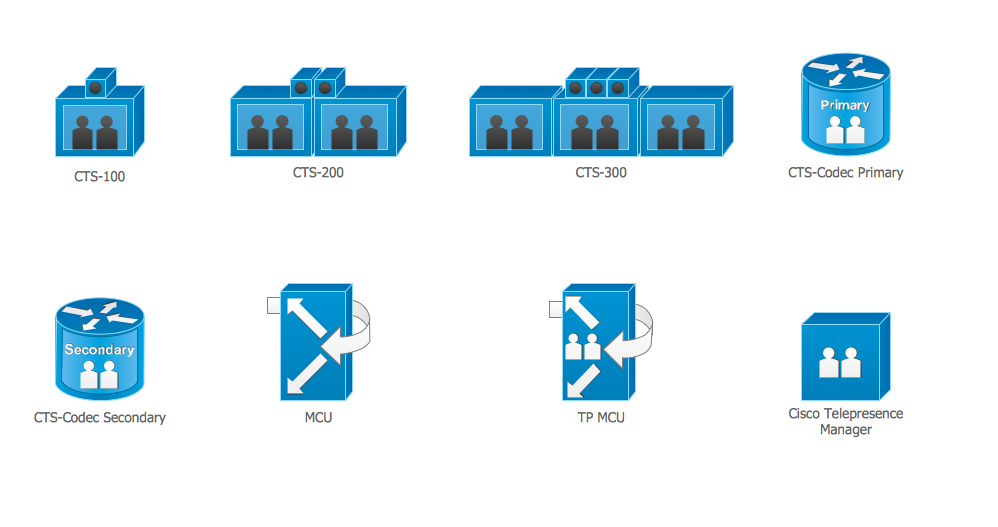
Cisco Telepresence. Cisco icons, shapes, stencils and symbols
The ConceptDraw vector stencils library Cisco Telepresence contains videoconference equipment symbols for drawing the computer network diagrams.UML Diagram
The accepted open standard that is used in software engineering and system design, when modeling object-oriented systems and business processes is known as Unified Modeling Language (UML). UML was created for definition, visualization, design and documentation software systems. It isn't a programming language, but on the base of UML model can be generated code. UML uses generic set of graphic notations for creation an abstract model of the system called UML-model. The UML notation lets visually represent requirements, subsystems, structural and behavioral patterns, logical and physical elements, etc. UML defines 13 types of diagrams: Class (Package), Use Case, Sequence, Object, Collaboration, Component, Timing, Interaction Overview, State Machine, Composite Structure, Activity, and Deployment. All these types of UML Diagrams can be fast and easy created with powerful ConceptDraw PRO software extended with special Rapid UML solution from Software Development area of ConceptDraw Solution Park.Social Media Flowchart Symbols
Social media is a popular view of mass communication which allows people, companies and organizations create, share, discover, modify, access, comment, discuss and exchange information through the Internet. Social Media Response solution for ConceptDraw PRO provides collection of 10 libraries with diversity of predesigned vector social media flowchart symbols for fast and easy creating interactive Social Media Flowcharts, Response Charts and Action Mind Maps.Circuits and Logic Diagram Software
Circuit diagram is a graphical representation of electrical circuits, wire connections between devices, among them power and signal connections. Circuit diagrams are successfully used during design, construction and maintenance of different electrical and electronic equipment, and also for visualizing expressions using a boolean algebra in the computer science. These diagrams don't show a physical arrangement of components. One of advanced application of ConceptDraw PRO software is electrical engineering. Included to ConceptDraw Solution Park, Electrical Engineering solution from the Engineering area offers templates, samples and incredibly large quantity of vector design elements of circuits and logic symbols, which are helpful for professional drawing Circuit diagrams, Logic circuit diagrams, Wiring diagrams, Electrical schematics, Digital and Analog logic designs, Integrated circuit schematics, Circuit board and Amplifier diagrams, Power systems diagrams, Maintenance and Repair diagrams of any difficulty.- Images Of All Geometrical Shapes And Figures
- Pictures Using Different Mathematical Shapes
- How To Make A Folder Using Mathematical Shapes Symbols And
- Geometrical Figures Images
- Make A Folder Using Mathematical Shapes Symbols And Figures
- Scientific Symbols Chart | Mathematics Symbols | Basic Flowchart ...
- Basic Flowchart Symbols and Meaning | How to Draw Geometric ...
- How to Draw Geometric Shapes in ConceptDraw PRO | Basic ...
- Using Geometric Shapes To Make Pictures
- Computer Charts Images
- Symbol Of Computer Shape
- Line Chart Template for Word | Physics Symbols | Mathematics ...
- Scientific Symbols Chart | Physics Symbols | Sun Solar System | Hd ...
- Mathematical Diagrams | Scientific Symbols Chart | Basic Network ...
- Mathematical Shapes Symbols And Figure
- Cisco Telepresence. Cisco icons, shapes , stencils and symbols ...
- Mathematical Diagrams | Basic Flowchart Symbols and Meaning ...
- Mathematics Symbols | Bar Diagram Math | Physics Symbols ...
- Campus Area Networks (CAN). Computer and Network Examples ...


