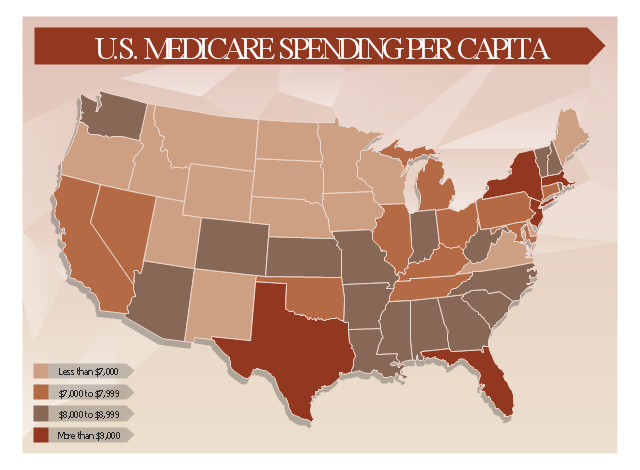
This healthcare economics infogram example was redesigned from the Wikimedia Commons file: Medicare spending per capita.png.
"Research by The Dartmouth Institute for Health Policy and Clinical Practice in the Dartmouth Atlas showed that in 2006, Medicare spending varied significantly by state. Other research quoted by the CEA Report indicated that up to 30% of Medicare costs could be saved if the middle- and high-cost states spent at the level of the lower-cost states.[1] Bear in mind that this is a Medicare comparison, so all the persons in the population analyzed are over 65.
References:
1. White House Council of Economic Advisors (CEA)-The Economic Case for Health Care Reform-June 2009-Page 19."
[commons.wikimedia.org/ wiki/ File:Medicare_ spending_ per_ capita.png]
The healthcare management thematic map sample "U.S. Medicare spending per capita" was created using the ConceptDraw PRO diagramming and vector drawing software extended with the Management Infographics solition from the area "Business Infographics" in ConceptDraw Solution Park.
Export from ConceptDraw DIAGRAM Document to a Graphic File
Now it’s easy to share your visual documents with other people in a form most convenient for them. ConceptDraw DIAGRAM can save your drawings and diagrams in a number of highly useful formats, including graphic files. You can save your drawing as a.PNG,.JPG, or other graphic format file.
This organization chart example was redesigned from the Wikimedia Commons file: US Navy Operating Forces Org Chart.png. [commons.wikimedia.org/ wiki/ File:US_ Navy_ Operating_ Forces_ Org_ Chart.png]
"The operating forces commanders and fleet commanders have a dual chain of command. Administratively, they report to the Chief of Naval Operations and provide, train, and equip naval forces. Operationally, they provide naval forces and report to the appropriate Unified Combatant Commanders. Commander Fleet Forces Command commands and controls fleet assets on both the Atlantic and Pacific coasts for interdeployment training cycle purposes. As units of the Navy enter the area of responsibility for a particular Navy area commander, they are operationally assigned to the appropriate numbered fleet. All Navy units also have an administrative chain of command with the various ships reporting to the appropriate Type Commander." [navy.mil/ navydata/ organization/ orgopfor.asp]
The org chart sample "US Navy operating forces" was created using the ConceptDraw PRO diagramming and vector drawing software extended with the 25 Typical Organizational Charts solution from the Management area of ConceptDraw Solution Park.
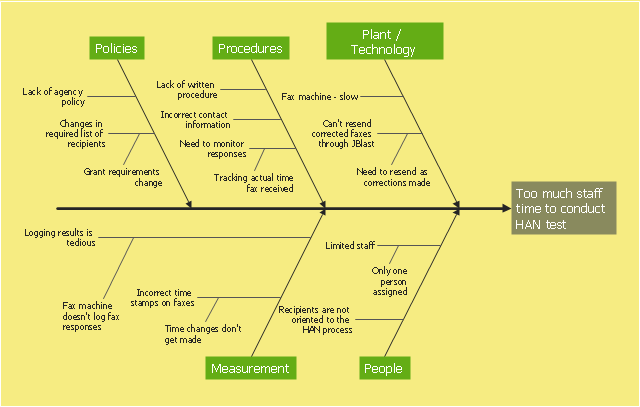
This example was created on the base of the figure from the website of Minnesota Department of Health. [health.state.mn.us/ divs/ opi/ qi/ images/ fishbone_ ex.png]
"Minnesota’s Health Alert Network (HAN) enables public health staff, tribal governments, health care providers, emergency workers, and others working to protect the public to exchange information during a disease outbreak, environmental threat, natural disaster, or act of terrorism." [health.state.mn.us/ han/ ]
The fishbone diagram example "HAN project" was created using the ConceptDraw PRO diagramming and vector drawing software extended with the Fishbone Diagrams solution from the Management area of ConceptDraw Solution Park.
Pyramid Diagram
Triangle diagram example of DIKW pyramid has 4 levels: data, information, knowledge and wisdom.HelpDesk
How to Save a Drawing as a Graphic File
ConceptDraw DIAGRAM can save your drawings and diagrams in a number of highly useful formats, including graphic files. You can save your drawing as a.PNG,.JPG, or other graphic format file.Flowchart design. Flowchart symbols, shapes, stencils and icons
A flowchart is a type of diagram which represents an algorithm, process or workflow, displays the steps as boxes of various kinds and depicts their order by connecting them with arrows. Any business graphic document will be more colorful and understandable if will use professional-looking and visual diagrams and flowcharts. Flowchart design gives versatile presenting and explaining of the process. ConceptDraw DIAGRAM flowchart software enhanced with Flowcharts solution helps effectively make Flowchart Design. Use of predesigned flowchart symbols and bright color palette offers a fresh view and favorably distinguishes the flowcharts designed in ConceptDraw DIAGRAM from the black and white flowcharts on a paper. Preferably to use no more than three or four colors and apply identical for the same shape types. The best flowchart design can be achieved by starting with Flowchart template, or any of suitable ready examples or samples offered in ConceptDraw STORE, open one of them and enter the proper text into each Flowchart shape. Each symbol of the flowchart has a definition that can't be changed. This means that all flowcharts shapes can be grouped in according to their meaning. Users with ConceptDraw DIAGRAM flowchart software can style groups of symbols with close definitions by color sets chosen from complementary palette. Almost all workflows can be depicted as a flowchart. Colored diagrams are more light for perception of the certain information, this is part of flowchart design. Bright colors need to be used in the key points of Decision symbols, to focus attention on their importance for whole process flow.
Pyramid Diagram
The representation of data in a hierarchical or pyramid-like form is one of the most effective and illustrative ways of structuring the data, information, ideas in different fields, among them marketing, management, business, finances, sales, consulting, media, and some others. Pyramid Diagram perfectly suits for this goal, especially if we talk about the representing some marketing strategies, information systems, social strategies. Pyramid Diagram looks like a triangle or reversed triangle that is divided visually on several layers. Each layer can be colored with its own color, this lets visually highlight important moments. ConceptDraw DIAGRAM diagramming and vector graphics software extended with Pyramid Diagrams solution from the Marketing area provides powerful drawing tools, templates, samples, and built-in vector pyramid objects, thus all required tools for equally easy drawing Three level pyramid diagram, Four level pyramid model, Five level pyramid, etc., at this your Pyramid diagrams can have 2D or 3D view as you like.Business Productivity - Marketing
Mind Map is effective tool for depiction the main idea and related concepts, and representation a thought process. Mind Maps have essential value in marketing field, advertising and sales. They help successfully accomplish marketing goals and easy get marketing answers, to achieve a sustainable competitive advantages and increasing sales. Mind Maps help in new product development, they allow to generate and structure ideas about its properties and features, to define the target customers, brainstorm the key words and phrases for advertising and sales materials. ConceptDraw MINDMAP is a perfect marketing diagramming and marketing strategy tool that help accomplish marketing goals, represent marketing information and easy design Marketing Mind Maps and Marketing Diagrams (Marketing Step Chart, Marketing Mix Diagram, Market Environment Analysis Charts, Sales Pyramids, Target and Marketing Scope Diagrams, Feature Comparison Chart, Product Position Map, Products Comparison Chart, Timeline, SWOT, Boston Growth Matrix, Ansoff Product-Market Growth Matrix) for further using in visual documents and presentations.SWOT Matrix Template
SWOT analysis is a structured planning method, which lets define the objective of the business, internal and external factors favorable or unfavorable for achieving this objective, represent Strengths, Weaknesses, Opportunities, and Threats on the SWOT Matrix. SWOT analysis can be conducted for an industry, company, product, place, or person. It lets to choose the best path for development of an organization, helps to avoid dangers, gives opportunity to establish relationship between the potential of an organization and the problems, lets to assess the values of profitability and compare them with performance of competitors, gives the possibility to expand and enhance the competitive advantages. SWOT and TOWS Matrix Diagrams solution included to ConceptDraw Solution Park contains wide variety of SWOT and TOWS matrix diagrams examples and samples, and also specially developed templates. Each SWOT template have great value in easy and quick drawing of SWOT matrices and diagrams in ConceptDraw DIAGRAM diagramming and vector drawing software for Mac OSX and Windows.
 Pie Charts
Pie Charts are extensively used in statistics and business for explaining data and work results, in mass media for comparison (i.e. to visualize the percentage for the parts of one total), and in many other fields. The Pie Charts solution for ConceptDraw DIAGRAM offers powerful drawing tools, varied templates, samples, and a library of vector stencils for simple construction and design of Pie Charts, Donut Chart, and Pie Graph Worksheets.
Pyramid Diagram
The Time-Money-Quality Triangle illustrates an advertising truism, that you can't have all three.HelpDesk
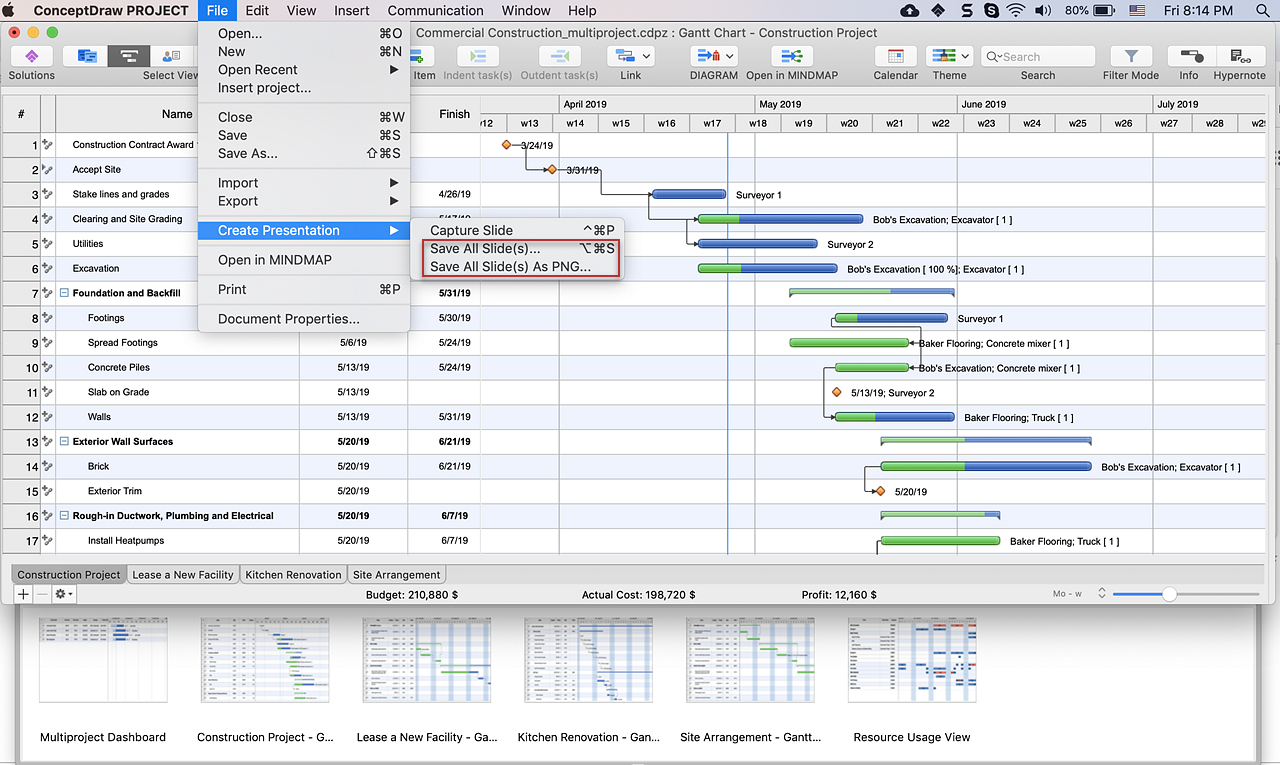
How to Get Images for Project Presentation on macOS
ConceptDraw PROJECT allows you to easily make slides for presentation.Pyramid Diagram
Pyramid chart example is included in the Pyramid Diagrams solution from Marketing area of ConceptDraw Solution Park.- Map Of Us Png
- U.S. Medicare spending per capita | Healthy Food Recipes | Healthy ...
- Pyramid Diagram | U.S. Medicare spending per capita | Pyramid ...
- Outstanding trends of wastewater treatment plants | United States ...
- How to Draw a Landscape Design Plan | Ribbrn Modern Arrow Png
- Percentages of the U.S. population by race | Geo Map - Asia ...
- U.S. Medicare spending per capita | Graphic User Interface | How To ...
- Percentages of the U.S. population by race | Pie Charts | Chart ...
- U.S. Medicare spending per capita | How to Draw a Circular Arrows ...
- United States Map Png
- Process Flowchart | U.S. Medicare spending per capita | Design ...
- Basic Flowchart Symbols and Meaning | U.S. Medicare spending ...
- U.S. energy consumption by source | Design elements - Stations ...
- U.S. Medicare spending per capita | Ribbon interface - Vector ...
- Professions - Vector stencils library | Percentages of the U.S. ...
- Middle East Map Png
- Distribution Vehicle Clipart Png
- DroidDia prime | Area Charts | Plumbing and Piping Plans ...
- Pie Charts | Chart Examples | Chart Templates | Percentage Chart Png
- U.S. Medicare spending per capita | ConceptDraw Arrows10 ...


