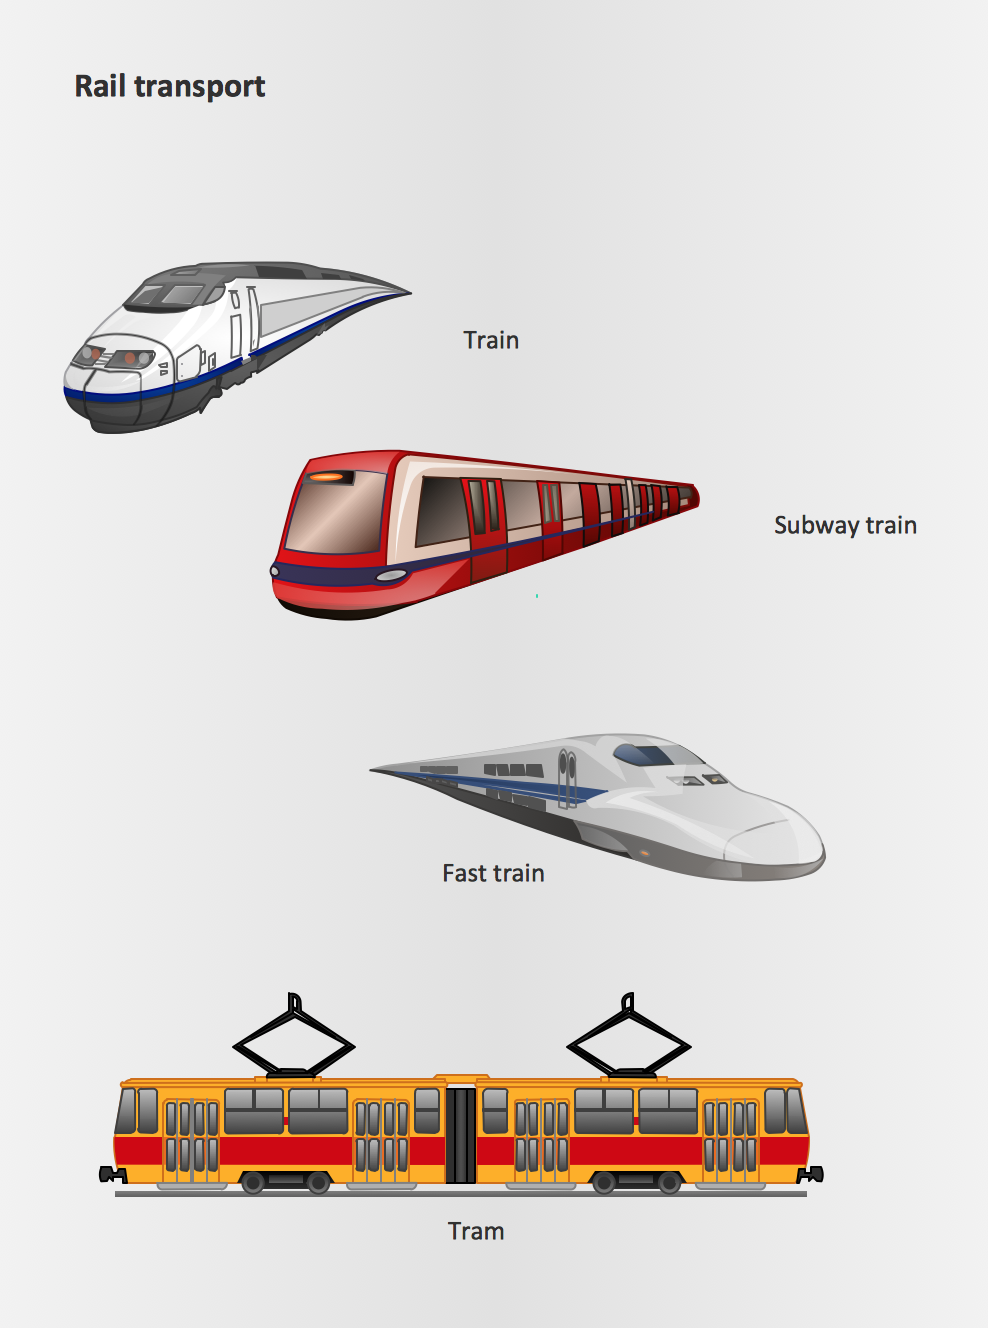
Rail transport - Design elements
The vector stencils library Rail transport contains clipart of railway transport for ConceptDraw DIAGRAM diagramming and vector drawing software. Use it to draw illustrations of trains and transportation of passengers and goods by railroads.
 ATM UML Diagrams
The ATM UML Diagrams solution lets you create ATM solutions and UML examples. Use ConceptDraw DIAGRAM as a UML diagram creator to visualize a banking system.
 Aerospace and Transport
This solution extends ConceptDraw DIAGRAM software with templates, samples and library of vector clipart for drawing the Aerospace and Transport Illustrations. It contains clipart of aerospace objects and transportation vehicles, office buildings and anci
 ConceptDraw Solution Park
ConceptDraw Solution Park collects graphic extensions, examples and learning materials
Network Topologies
Network topology is a topological structure of computer network, which can be physical or logical. The physical topology depicts location of different computer network elements such as computers, cables and other devices. The logical topology visually displays network dataflows from one device to another. Sometimes network logical and physical topologies can be the same. ConceptDraw DIAGRAM diagramming and vector drawing software is powerful for drawing network maps and network topologies diagrams of any kinds and complexity thanks to the Computer Network Diagrams solution from the Computer and Networks area. ConceptDraw STORE proposes collection of network icons libraries and a lot of Network Topology Diagram examples, samples and templates which were created at ConceptDraw DIAGRAM software specially for Computer Network Diagrams solution. There are six basic types of the network topologies: Bus, Star, Ring, Mesh, Tree, Fully Connected. You can fast and easy design professional-looking diagram for each of them using the ConceptDraw DIAGRAM tools. There are plenty of web Visio-like diagramming software available. Web based diagrams software can be powerful, but sometimes it is essential to have desktop software. One of the most advanced diagrams tools like Visio for Mac OS is ConceptDraw DIAGRAM app.
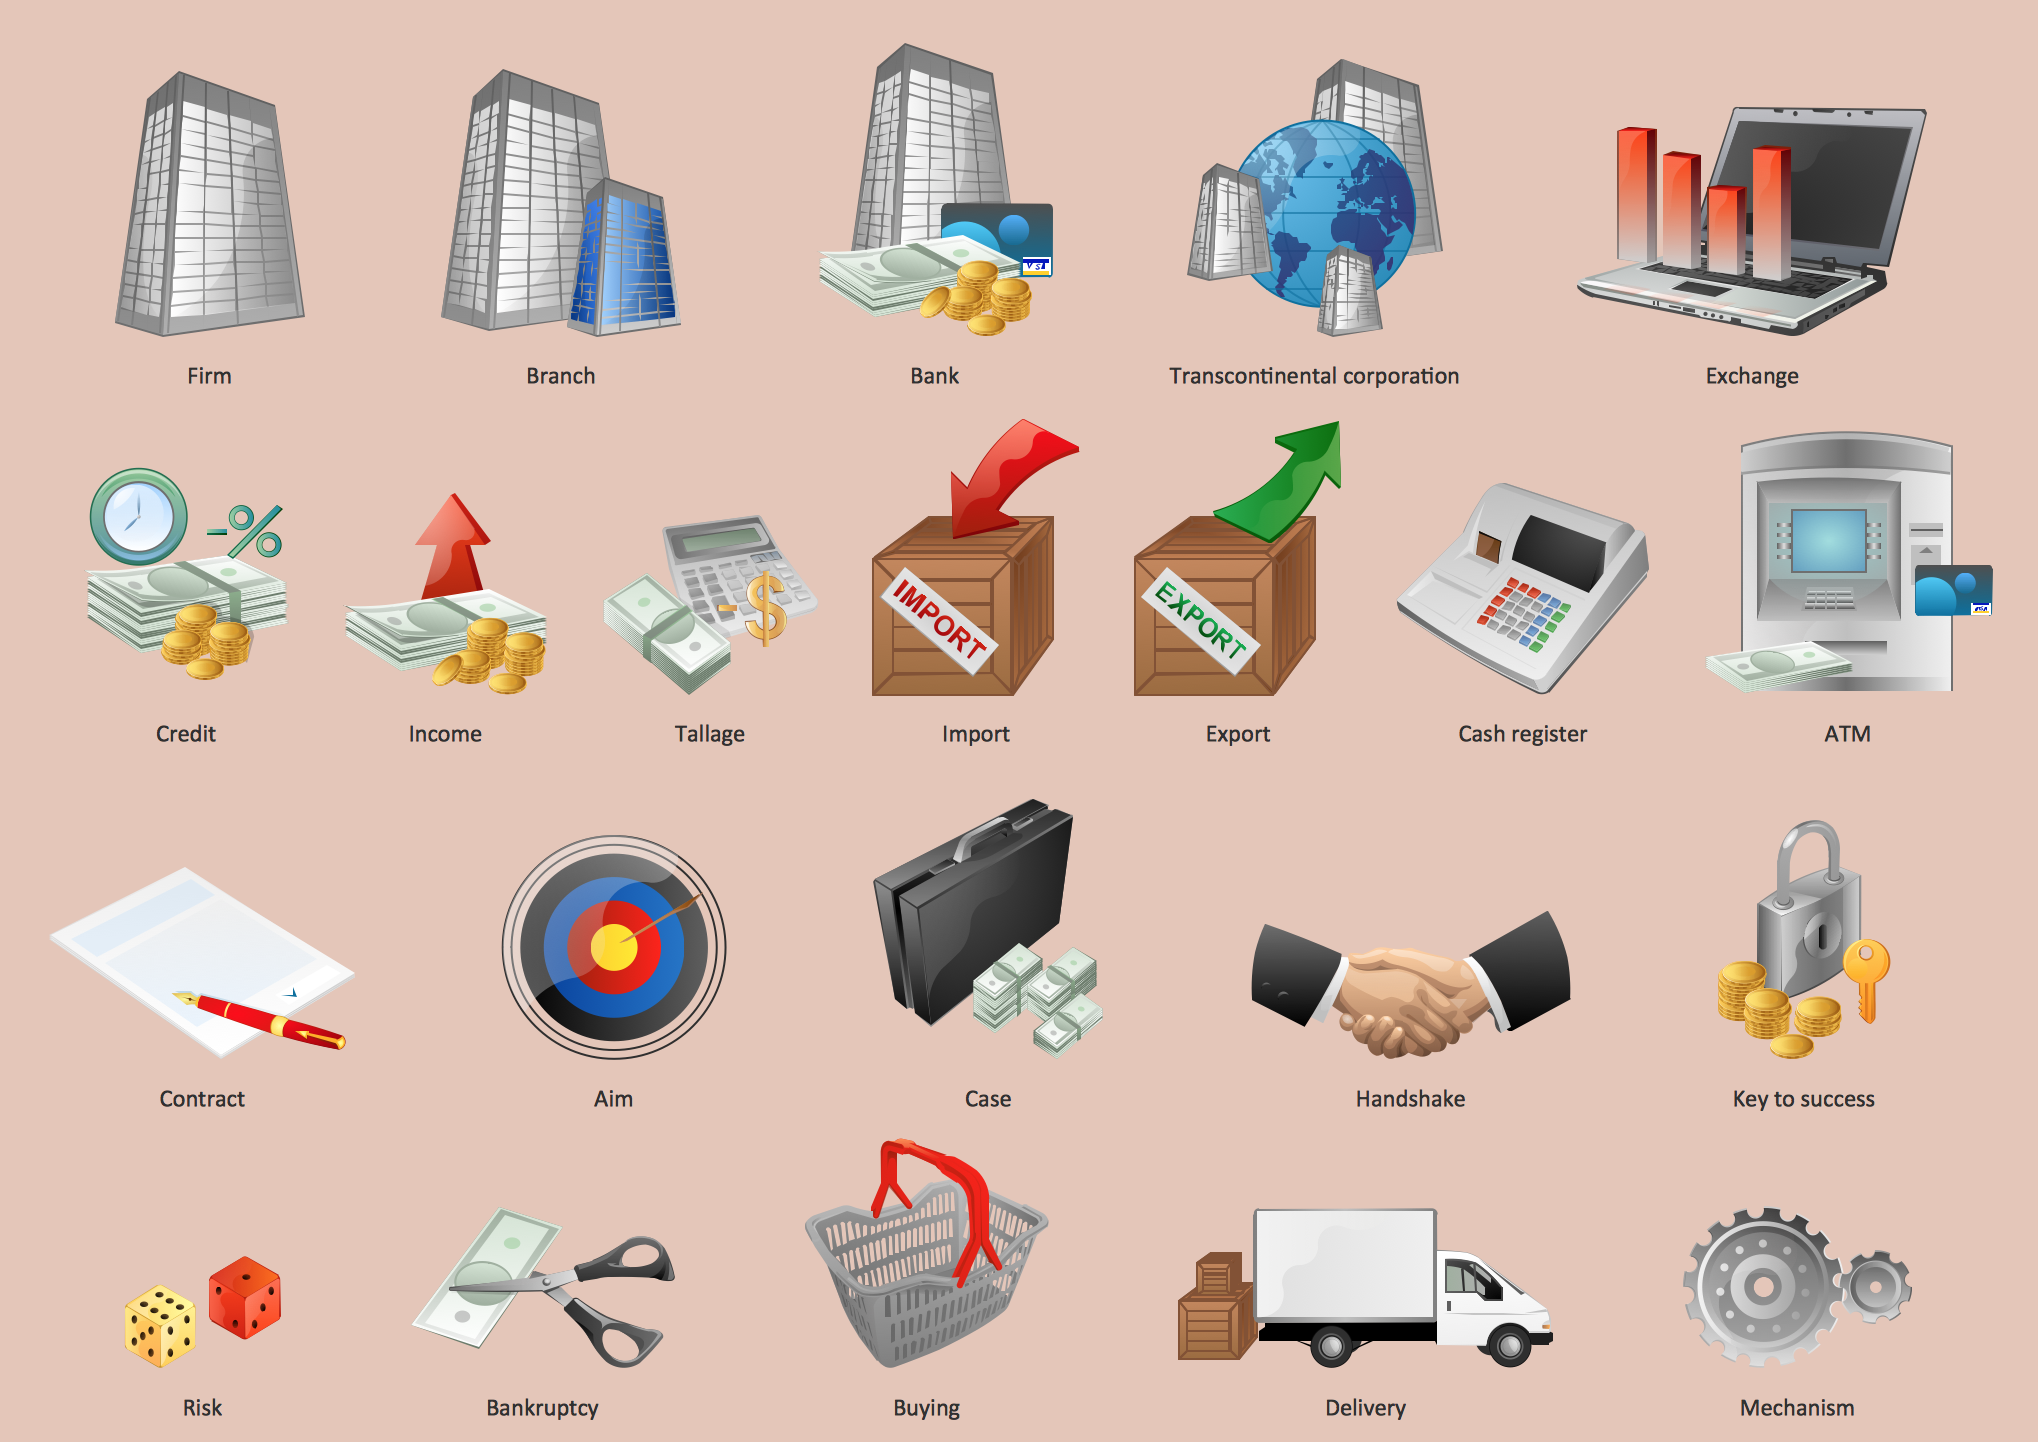
Business - Design Elements
Choose which of business design elements you love best. Design your own style with Business and Finance Solutions from ConceptDraw DIAGRAM. We created a full set of elements, business samples, templates and libraries with vector clip art for drawing the Business Illustrations. Mark your report or presentation, pay an attention of audience on your drawings with vector business design elements.
 Event-driven Process Chain Diagrams
Event-Driven Process Chain Diagrams solution extends ConceptDraw DIAGRAM functionality with event driven process chain templates, samples of EPC engineering and modeling the business processes, and a vector shape library for drawing the EPC diagrams and EPC flowcharts of any complexity. It is one of EPC IT solutions that assist the marketing experts, business specialists, engineers, educators and researchers in resources planning and improving the business processes using the EPC flowchart or EPC diagram. Use the EPC solutions tools to construct the chain of events and functions, to illustrate the structure of a business process control flow, to describe people and tasks for execution the business processes, to identify the inefficient businesses processes and measures required to make them efficient.
 Fishbone Diagram
Fishbone Diagrams solution extends ConceptDraw DIAGRAM software with templates, samples and library of vector stencils for drawing the Ishikawa diagrams for cause and effect analysis.
 Entity-Relationship Diagram (ERD)
An Entity-Relationship Diagram (ERD) is a visual presentation of entities and relationships. That type of diagrams is often used in the semi-structured or unstructured data in databases and information systems. At first glance ERD is similar to a flowch
 AWS Architecture Diagrams
AWS Architecture Diagrams with powerful drawing tools and numerous predesigned Amazon icons and AWS simple icons is the best for creation the AWS Architecture Diagrams, describing the use of Amazon Web Services or Amazon Cloud Services, their application for development and implementation the systems running on the AWS infrastructure. The multifarious samples give you the good understanding of AWS platform, its structure, services, resources and features, wide opportunities, advantages and benefits from their use; solution’s templates are essential and helpful when designing, description and implementing the AWS infrastructure-based systems. Use them in technical documentation, advertising and marketing materials, in specifications, presentation slides, whitepapers, datasheets, posters, etc.
 Picture Graphs
Typically, a Picture Graph has very broad usage. They many times used successfully in marketing, management, and manufacturing. The Picture Graphs Solution extends the capabilities of ConceptDraw DIAGRAM with templates, samples, and a library of professionally developed vector stencils for designing Picture Graphs.
 Data Flow Diagrams (DFD)
Data Flow Diagrams solution extends ConceptDraw DIAGRAM software with templates, samples and libraries of vector stencils for drawing the data flow diagrams (DFD).
 Fishbone Diagrams
The Fishbone Diagrams solution extends ConceptDraw DIAGRAM software with the ability to easily draw the Fishbone Diagrams (Ishikawa Diagrams) to clearly see the cause and effect analysis and also problem solving. The vector graphic diagrams produced using this solution can be used in whitepapers, presentations, datasheets, posters, and published technical material.
- Purchase order processing UML activity diagram | Money - Vector ...
- UML Deployment Diagram Example - ATM System UML diagrams ...
- UML Deployment Diagram Example - ATM System UML diagrams ...
- Process Flowchart | Bank System | How to Create a Bank ATM Use ...
- Draw A Chart On Means Of Transport
- UML activity diagram - Cash withdrawal from ATM | Global Payment ...
- UML Activity Diagram | Diagramming Software for Design UML ...
- Atm Cash Withdrawal Steps In A Flow Chart Pic
- Presentation Clipart | Illustration | ATM UML Diagrams | Banking ...
- Process Flowchart | How to Connect Social Media DFD Flowchart ...
- UML Class Diagram Example for Transport System | Flow chart ...
- Activity Diagram Tutorial For Financial And Accounting
- Quality Function Deployment Diagram Hd Images
- Bank Activity Diagram
- Class UML Diagram for Bank Account System | UML class diagram ...
- Draw A Uml Use Class Diagram For Opening A Bank Account
- UML package diagram for Bank account | Bank UML Diagram ...
- Diagramming Software for Design UML Use Case Diagrams ...
- UML use case diagram - Banking system
- Electrical Engineering | UML Deployment Diagram Example - ATM ...


