Accounting Cycle Example
Accounting cycle is a sequence of activities which are involved in completing an accounting process. The length of an accounting cycle is changed from organization to organization, this can be month, quarter, half-year, or year. ConceptDraw DIAGRAM diagramming and vector drawing software extended with Accounting Flowcharts Solution from the Finance and Accounting Area of ConceptDraw Solution Park offers the extensive drawing tools, library with ready-to-use vector elements which will help you design any accounting cycle example you need.What is the Accounting Cycle?
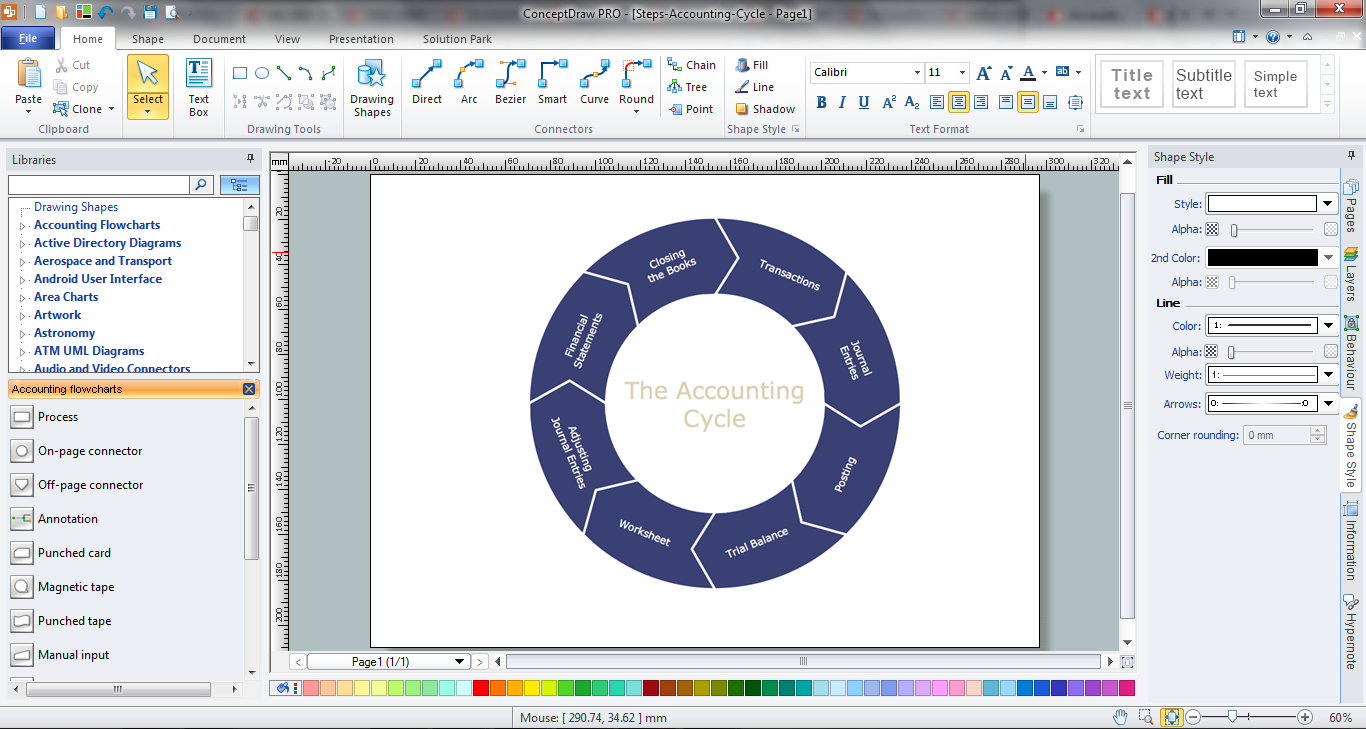
What is the accounting cycle? The accounting cycle is a sequence of steps that occur in the accounting period and include the processes of identifying, collecting, analyzing documents, recording transactions, classifying, summarizing, and reporting financial information of an organization.Steps in the Accounting Process
Steps in the Accounting Process - The Accounting Process is a sequence of organization activities that is used for gaining quantitative information about the finances. This complex process consists of a set of sequential steps. 9 steps in the accounting process: Analysis of Business Transactions, Make Journal Entries, Post to Ledger Accounts, Prepare Trial Balance, Make Adjusting Entries, Adjusted Trial Balance, Prepare Financial Statements, Close Accounts, Post-Closing Trial Balance.Accounting Flowchart Symbols
Accounting is a well known and popular tool used for gaining full quantitative information about the finances. The accounting process includes extensive set of activities that begins with transactions and ends with closing of books. It contains all financial information for a given organization, the data about incomes, expenditures, purchases, sales, return, payroll, and many other numerical information. The excellent possibility to create great-looking Accounting Flowcharts is offered by professional ConceptDraw DIAGRAM diagramming and vector drawing software. It includes the Accounting Flowcharts solution containing wide variety of predesigned accounting flowchart symbols. All symbols are easy recognizable, commonly used, vector and professionally designed, so are capable effectively save your time and efforts when representing all stages of accounting work process, the flow of data in an organization, accounting procedures and processes, documents, tasks, responsible people, users, components and authorizations.Accounting Flowchart
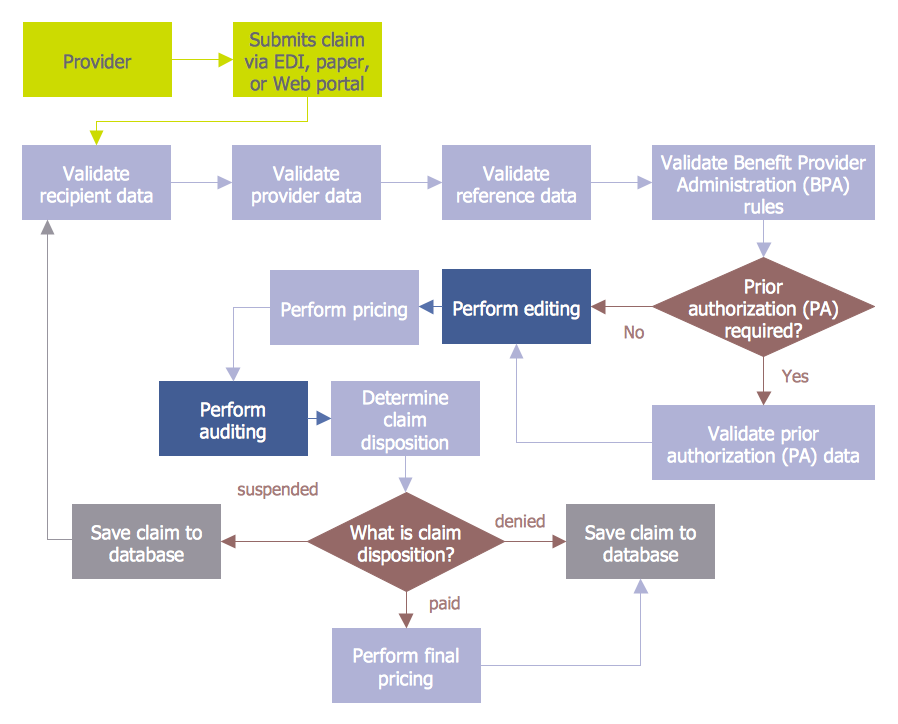
Accounting flowchart is a system of processes to represent accounting system of an organization. If you need to know how accounting processes work and how each operation is done, the Accounting Flowcharts Solution for ConceptDraw DIAGRAM has a predesigned library, tips, methods and symbols for easy drawing an Accounting Flowchart.Auditing Process. Audit Planning Process
Auditing Process, Audit Planning Process - The audit is complex process of independent examination of data, statements, operations, financial performances of an enterprise for a stated purpose. The auditing process consists of defined quantity of audit steps. Planning is fundamental stage of auditing process. The carefully thought-out audit planning process ensures the success of the business project.Workflow to Make a Purchase. Accounting Flowchart Example
Purchasing Workflow Chart as a methods for documenting accounting information systems. Symbols and Methods for designing Accounting System.Flowchart Software
A Flowchart visualizes a process or algorithm of a program as step blocks composed of shapes, connected with arrows that show the process flow direction. The Flowcharts give users the ability to represent structural data in a visual form and are widely used to visualize the business and technical processes, as well as software algorithms. ConceptDraw DIAGRAM is a powerful Mac OS X and Windows technical diagramming, business diagramming and flowchart drawing software. Numerous vector stencils, built-in templates and samples created by professional designers are included at the basic package. ConceptDraw DIAGRAM is a classic flowchart maker, which exactly follows the industry standards and provides ready-to-use flowchart symbols gathered at the solutions of ConceptDraw Solution Park. Use the free trial versions of ConceptDraw DIAGRAM software for Mac and PC to experience the powerful possibilities of ConceptDraw DIAGRAM in designing the Flowcharts, Flow Diagrams, Business Flow Charts of different types, styles, and degree of complexity.Purchasing Flowchart - Purchase Order. Flowchart Examples
Create your own flow charts of purchasing business processes using the ConceptDraw DIAGRAM diagramming and vector drawing software extended with the Accounting Flowcharts solution from the Finance and Accounting area of ConceptDraw Solution Park. The flow chart example shows the steps of purchasing business process.Audit Procedures
Audit procedures are the specific tests and methods that auditor executes when gathering the evidence which are necessary for making an opinion on the financial statements of the firm. There are three types of audit procedures: data selection, reliability validation, relevance confirmation. Thanks to the extensive drawing tools which provides the Audit Flowcharts solution from the Finance and Accounting area of ConceptDraw Solution Park, you can easy and effectively develop and realize various audit procedures.Why flowchart is important to accounting information system?
Flowcharts are used to represent accounting information in a system. There are special symbols which are used to create accounting flowcharts.Activity Network Diagram Method
Activity Network Diagram - This sample was created in ConceptDraw DIAGRAM diagramming and vector drawing software using the Seven Management and Planning Tools solution from the Management area of ConceptDraw Solution Park. This sample shows the PERT (Program Evaluation Review Technique) chart of the request on proposal. A request for proposal (RFP) is a request of the company or the organization to potential suppliers to submit the business proposals for service or goods that it is interested to purchase. The RFP is represented on the initial procurement stage and allows to define the risks and benefits.Flowchart design. Flowchart symbols, shapes, stencils and icons
A flowchart is a type of diagram which represents an algorithm, process or workflow, displays the steps as boxes of various kinds and depicts their order by connecting them with arrows. Any business graphic document will be more colorful and understandable if will use professional-looking and visual diagrams and flowcharts. Flowchart design gives versatile presenting and explaining of the process. ConceptDraw DIAGRAM flowchart software enhanced with Flowcharts solution helps effectively make Flowchart Design. Use of predesigned flowchart symbols and bright color palette offers a fresh view and favorably distinguishes the flowcharts designed in ConceptDraw DIAGRAM from the black and white flowcharts on a paper. Preferably to use no more than three or four colors and apply identical for the same shape types. The best flowchart design can be achieved by starting with Flowchart template, or any of suitable ready examples or samples offered in ConceptDraw STORE, open one of them and enter the proper text into each Flowchart shape. Each symbol of the flowchart has a definition that can't be changed. This means that all flowcharts shapes can be grouped in according to their meaning. Users with ConceptDraw DIAGRAM flowchart software can style groups of symbols with close definitions by color sets chosen from complementary palette. Almost all workflows can be depicted as a flowchart. Colored diagrams are more light for perception of the certain information, this is part of flowchart design. Bright colors need to be used in the key points of Decision symbols, to focus attention on their importance for whole process flow.
Business Process Optimization
Business process optimization is one of the most important components of the business process management which helps increase the effectiveness of organization work. ConceptDraw DIAGRAM diagramming and vector drawing software extended with Business Process Workflow Diagrams solution from the Business Processes area of ConceptDraw Solution Park ideally suits for effective business process optimization, for determination the opportunities for improvements and enhancements the processes, cost reduction and cost savings.Sales Process Flowcharts
ConceptDraw DIAGRAM diagramming and vector drawing software extended with Sales Flowcharts solution from the Marketing area of ConceptDraw Solution Park offers the set of extensive tools for quick and easy drawing professional looking Sales Process Flowcharts.EPC for Configuring an Enterprise Resource Planning
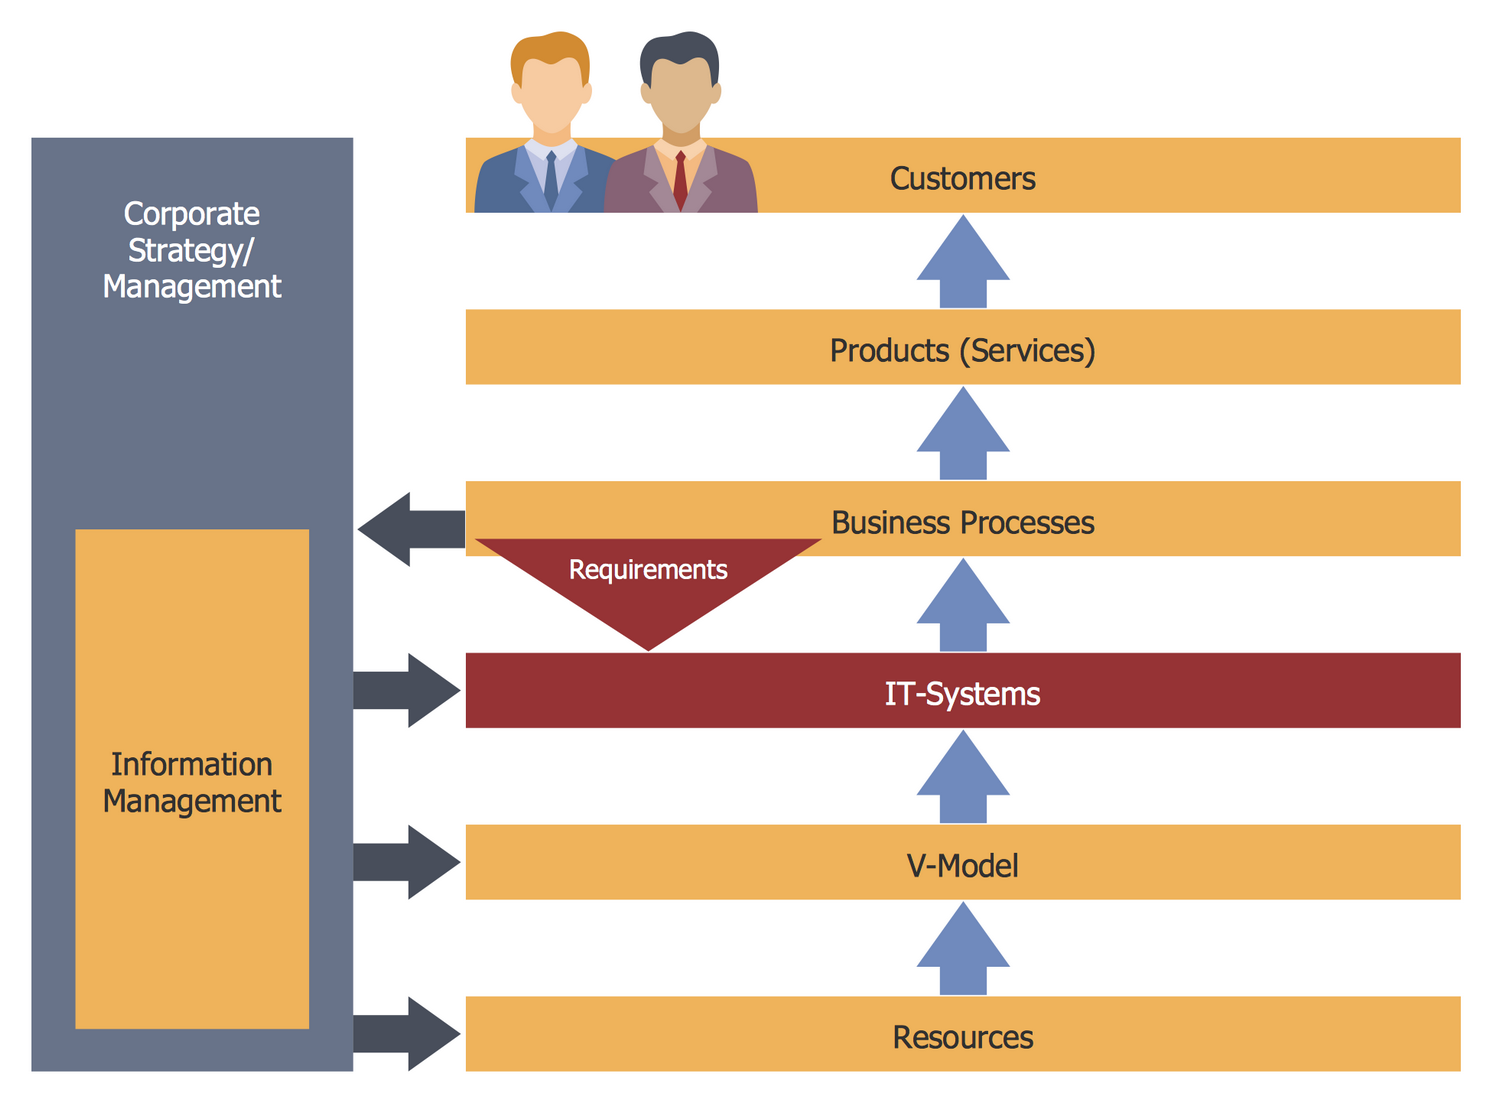
Event-Driven Process Chain Diagrams for improvement throughout an organisation. ConceptDraw DIAGRAM - software that reduces the time needed to create a business process model.What process should be essentially adopted. Accounting Flowchart Example
The Accounting flowchart shows how information flows from source documents through the accounting records. The are based on the accounting procedures or processes.Flow Chart Symbols
ConceptDraw DIAGRAM software extended with Flowcharts Solution from the "Diagrams" Area is a powerful software that will help you design the flowcharts for any business and technical processes, and software algorithms thanks to the predesigned flow chart symbols. Flowcharts solution offers 2 libraries with large collection of vector flow chart symbols: Flowchart Library, Flowcharts Rapid Draw Library that you can use to create your flowcharts quick and easy. Flowchart Solution is number of diagraming stencils including special set of flow chart symbols such as: terminator, process, decision which indicates a decision points between two or more paths in a flowchart, symbol of delay. Major symbols includes symbol of data, document or multiple documents, subroutine, preparation for processing of documents. Also includes symbols: display, manual input, manual loop, loop limit, stored data,connectors and suming junctions, sort and merge operations, symbols of database and internal storFlow Map
A Flow Map is a type of thinking maps which help easy organize and understand information. It consists of the set of boxes and arrows, and visually displays a sequence of events. ConceptDraw DIAGRAM diagramming and vector drawing software extended with Flowcharts Solution from the "Diagrams" Area of ConceptDraw Solution Park allows you to draw in a few minutes the Flow Map of any degree of complexity.Network Diagram Software. LAN Network Diagrams. Physical Office Network Diagrams
Physical LAN Diagrams illustrate the communication schemes of Local Area Networks, the physical network connection of computers and networks arrangement on the small areas - at homes, offices, and other buildings. ConceptDraw DIAGRAM is a perfect network diagramming software with samples and examples of WAN and LAN Diagrams, templates and collection of network components libraries. Computer Network Diagrams Solution for ConceptDraw DIAGRAM Mac and Windows is ideal for IT professionals, network engineers and network designers who need to visualize network architecture, to document LANs physical structure and arrangement, to draw Local Area Network (LAN) diagrams and schematics, WAN diagrams, physical office network diagrams and topologies, wiring drawings, etc. You can design all them easy using the predesigned vector objects of computers and computer network devices, hardware devices, peripheral devices, external digital devices, internet and logical symbols, and many other stencils from the Computer Network Diagrams libraries. ConceptDraw DIAGRAM offers a powerful and easy-to-use solution for those who looking for a Visio alternative for Mac. It is a world-class diagramming platform with dynamic presentation power.
- What is the Accounting Cycle ? | Circular Diagram | Accounting ...
- What is the Accounting Cycle ? | Steps of Accounting Cycle | Why ...
- Steps in the Accounting Process | What is the Accounting Cycle ...
- Steps of Accounting Cycle | What is the Accounting Cycle ? | Steps in ...
- Steps of Accounting Cycle | What is the Accounting Cycle ? | Steps in ...
- What is the Accounting Cycle ? | Steps of Accounting Cycle ...
- Steps of Accounting Cycle | What is the Accounting Cycle ...
- Flow Diagram Of Purchases Transaction Through Accounting Cycle
- Steps of Accounting Cycle | Steps in the Accounting Process ...
- Accounting Flowchart Symbols | What is the Accounting Cycle ...
- Steps of Accounting Cycle | What is the Accounting Cycle ? | Steps in ...
- Steps in the Accounting Process | Steps of Accounting Cycle | What ...
- Steps in the Accounting Process | Steps of Accounting Cycle | How ...
- Steps of Accounting Cycle | What is the Accounting Cycle ...
- Mind Maps Accounting Transactions Cycles
- Steps of Accounting Cycle | Steps in the Accounting Process | Why ...
- Steps of Accounting Cycle | Steps in the Accounting Process | What ...
- Steps of Accounting Cycle | Purchase Process Flow Chart ...
- Drawing Workflow Diagrams | Steps of Accounting Cycle | What is ...
- Purchasing Flow Chart. Purchasing Flowchart Example | Workflow to ...


