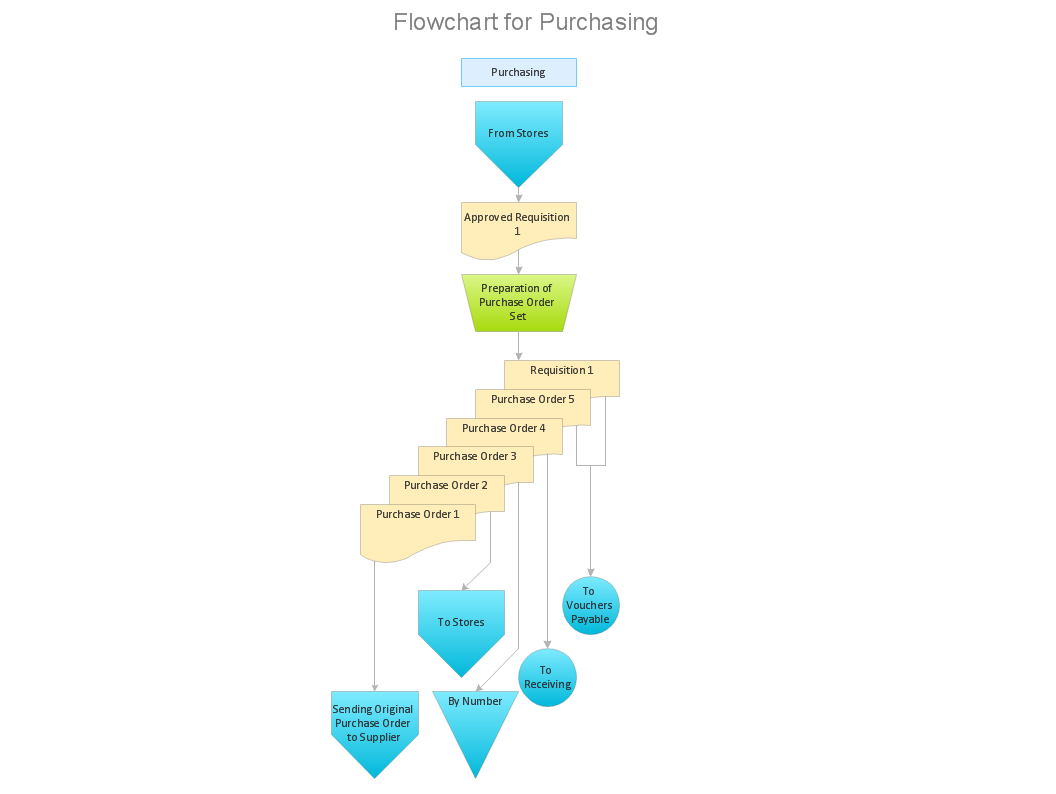
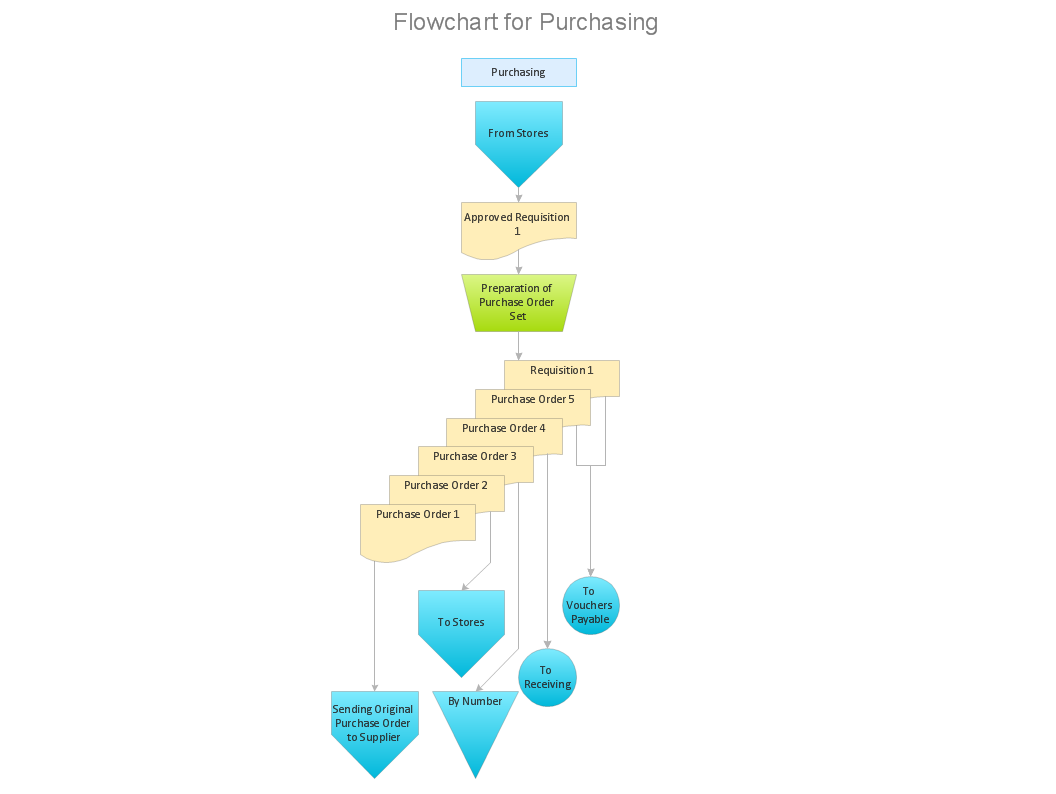
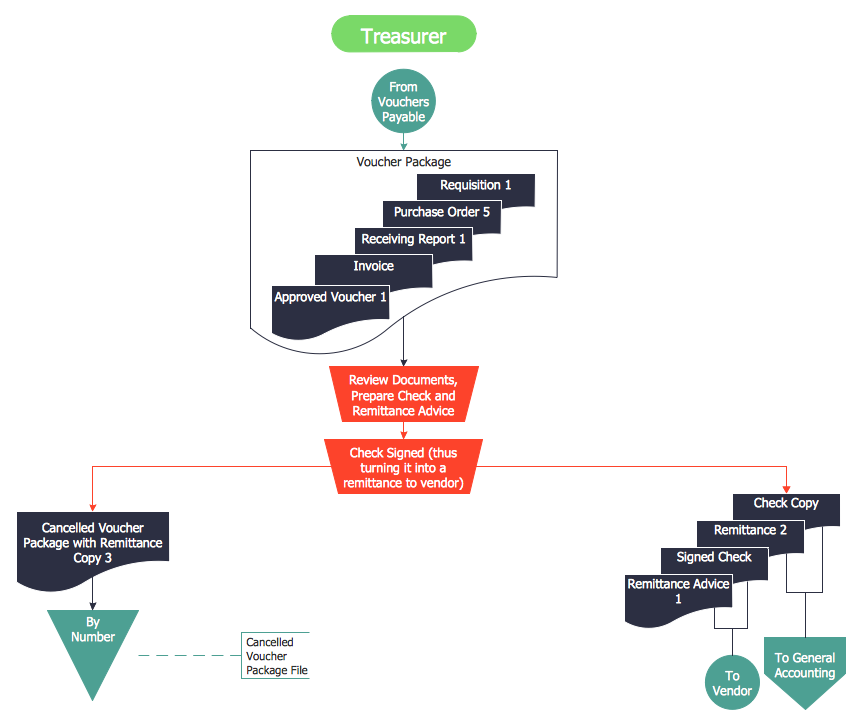
Introduction to bookkeeping: Accounting flowchart process
Everything about Bookkeeping: Accounting flowchart process. Which symbols to use, how to make a chart.What can go wrong if the purchasing process is not followed?
Make sure that your purchasing process complies with the standards and regulations. Common key elements of purchasing process.Basic Flowchart Symbols and Meaning
Flowcharts are the best for visually representation the business processes and the flow of a custom-order process through various departments within an organization. ConceptDraw PRO diagramming and vector drawing software extended with Flowcharts solution offers the full set of predesigned basic flowchart symbols which are gathered at two libraries: Flowchart and Flowcharts Rapid Draw. Among them are: process, terminator, decision, data, document, display, manual loop, and many other specific symbols. The meaning for each symbol offered by ConceptDraw gives the presentation about their proposed use in professional Flowcharts for business and technical processes, software algorithms, well-developed structures of web sites, Workflow diagrams, Process flow diagram and correlation in developing on-line instructional projects or business process system. Use of ready flow chart symbols in diagrams is incredibly useful - you need simply drag desired from the libraries to your document and arrange them in required order. There are a few serious alternatives to Visio for Mac, one of them is ConceptDraw PRO. It is one of the main contender with the most similar features and capabilities.
Accounts Payable Process Flow Chart
Accounts Payable Process Flow Chart - ConceptDraw PRO diagramming and vector drawing software extended with Accounting Flowcharts Solution provides the useful tools that will help you create easily and quickly. The Accounts Payable Process Flow Chart is very popular and widely used type of accounting flowcharts. Now their designing is simple thanks to the Accounting Flowcharts Solution that provides the Accounting Flowcharts library of predesigned commonly-used shapes and a set of templates and samples.Types of Flowchart - Overview
When designing a process or an instruction in clear and understandable way, you should consider creating a flowchart. You can avoid spending a lot of time understanding complex concepts as they get clear with different diagrams. The flowcharts are very popular diagram type, they are useful at different fields from the description business processes to the presentation of cooking recipes. Basic Flowchart, Business Process Modeling Diagram, Process Flowchart, Cross Functional Flowchart, Procedure Flowchart, Data Flow Diagram, IDEF Flowchart, SDL Diagram, Workflow Diagram, Document Flowchart, Program Flowchart, Value Stream Map, System Flowchart, Highlight Flowchart, Sales Flowchart are the main types flowchart. The ConceptDraw PRO is one of the professional applications which has great advantages and using which you can create different types of Flowcharts easy and fast. Try to draw an illustrative and comprehensible diagram in ConceptDraw PRO describing the processes instead of writing complex long text and make sure how it is convenient. Visio is expensive, and if you use it in a team environment, these costs are compounded. ConceptDraw PRO is an affordable alternative to Visio and luckily, it comes with a team plan. ConceptDraw PRO can import and export Visio files, so Mac users can collaborate with PC users stuck on Microsoft's software.
Business process Flow Chart — Event-Driven Process chain (EPC) diagrams
Event-Driven Process chain Diagrams for improvement throughout an organisation. Best software for Process Flow Diagram. The Event-driven Process Chain (EPC) Diagrams allows managers to plan processes and resources.Pyramid Chart Examples
Pyramid Charts and Triangle Diagrams are used to visually structure the topics and progressively order the quantitative data. They allow to illustrate hierarchical structure of the topics, proportional, interconnected and containment relations among the topics. The multilevel Pyramids and Triangle diagrams are constructed oriented up or down and divided into several horizontal slices. They are effectively used to represent marketing strategies, social strategies, information systems, market value, etc., to illustrate presentations, websites, documents, reports in business, finances, sales, management, marketing, media, training, consulting, and many other fields. To maximize the efficiency in drawing the Pyramid Charts, use the ConceptDraw PRO diagramming and vector drawing software extended with Pyramid Diagrams solution from Marketing area, which contains the set of Pyramid Chart examples, samples, templates and vector design elements of triangular diagrams and pyramids with different quantity of levels for various needs.- Credit approval process - Cross-functional flowchart | Approval ...
- Approval Process and Segregation of Responsibilities Accounting ...
- How to Make an Accounting Process Flowchart | Accounting ...
- Account Flow Chart Sample
- Invoice payment process - Flowchart | Global Payment Solutions ...
- Invoice payment process - Flowchart | Accounting Flowcharts ...
- Approval Process and Segregation of Responsibilities Accounting ...
- Accounting Flowchart
- Accounting Flowchart Purchasing Receiving Payable and Payment ...
- Voucher payable flowchart | Accounting Flowchart Purchasing ...
- Accounts Payable Flowchart | Accounting Flowcharts | Accounts ...
- Process Flowchart | Approval Process and Segregation of ...
- Sample Purchasing Process Flow Chart
- Accounting Flowchart : Purchasing, Receiving, Payable and ...
- Purchasing Flow Charts
- Purchasing Process Flow Chart Example
- Work Order Process Flowchart . Business Process Mapping ...
- Accounting Flowchart : Purchasing, Receiving, Payable and ...
- Basic Flowchart Symbols and Meaning | Process Flowchart | Types ...
- Purchase Process Flow Chart , Receiving Process Flow Chart


