Data structure diagram with ConceptDraw DIAGRAM
Data structure diagram (DSD) is intended for description of conceptual models of data (concepts and connections between them) in the graphic format for more obviousness. Data structure diagram includes entities description, connections between them and obligatory conditions and requirements which connect them. Create Data structure diagram with ConceptDraw DIAGRAM.What is the Accounting Cycle?
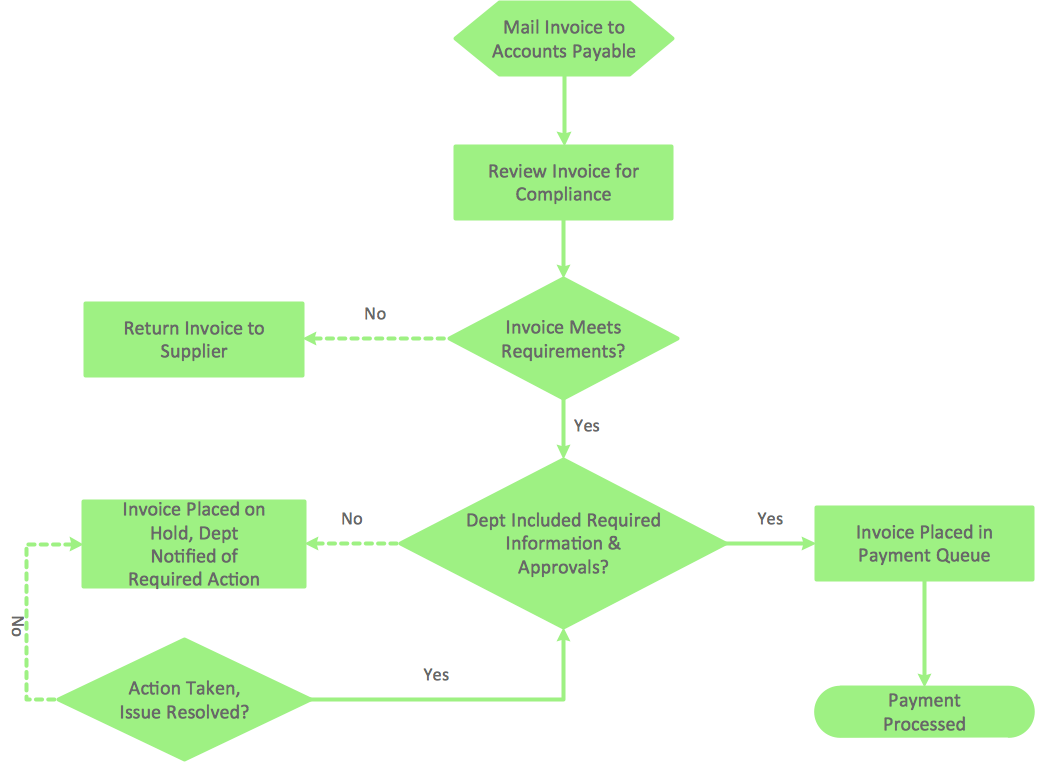
What is the accounting cycle? The accounting cycle is a sequence of steps that occur in the accounting period and include the processes of identifying, collecting, analyzing documents, recording transactions, classifying, summarizing, and reporting financial information of an organization.Flowchart Program Mac
ConceptDraw software has been developed for drawing any type of flowchart. Use RapidDraw - thi is flowchart maker technology for adding new objects to a flowchart quickly. This is technology of fast drawing technique focused on making great-looking flowcharts quickly. To get started using it download flowchart maker ConceptDraw DIAGRAM.
 Entity-Relationship Diagram (ERD)
An Entity-Relationship Diagram (ERD) is a visual presentation of entities and relationships. That type of diagrams is often used in the semi-structured or unstructured data in databases and information systems. At first glance ERD is similar to a flowch
Workflow Diagram Symbols
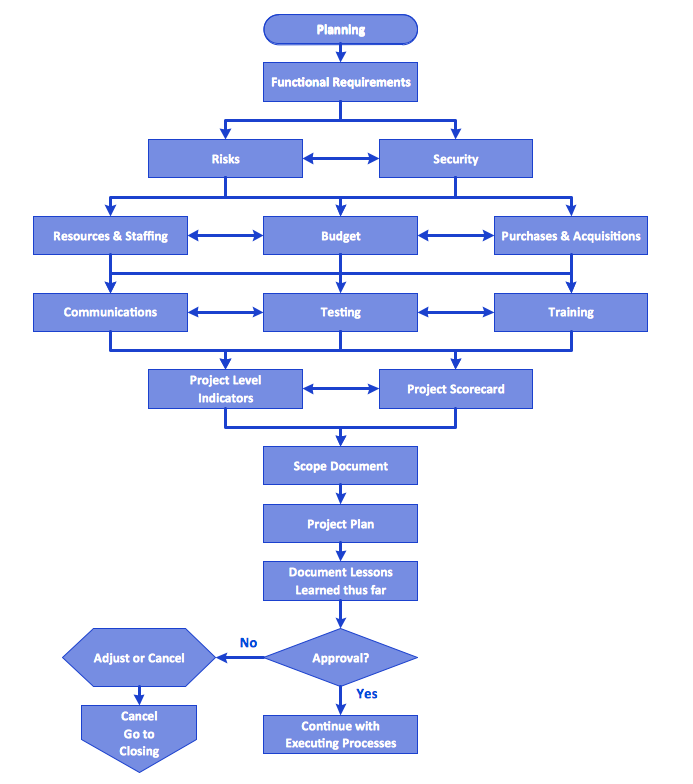
Workflow Diagram is an acknowledged method of drawing the processes and business processes, which uses the concerted set of symbols for depicting different kinds of steps or relations. Often it is named the Process Flow Diagram, but the real Process Flow Diagram uses different visual notations and different flowchart symbols. The professionally designed Workflow diagram also may be used for the same purpose as a Critical process flow diagram. Nevertheless, there are many cases when you may need to make your Workflow Diagram more bright and graphic. ConceptDraw DIAGRAM diagramming software extended with Workflow Diagrams solution from Business Processes area of ConceptDraw Solution Park possesses the powerful properties of software for Workflow diagram design. It delivers rich set of business process workflow diagram symbols, which help users to accurately diagram the workflow scenarios and to design great-looking and attractive Workflow Diagrams and Process Flow Diagrams better-suited for presentations, websites, reports, and other documents.SDL Diagram
Specification and Description Language (SDL) is used for creating the object-oriented diagrams, visualizing the processes of the state machines for the systems of communication, telecommunication, automotive, aviation and medical industries. SDL is a specification language for creating specifications, descriptions of the behavior, data, and inheritance for real-time systems. This sample shows the SDL Diagram of the process game.Introduction to Cloud Computing Architecture
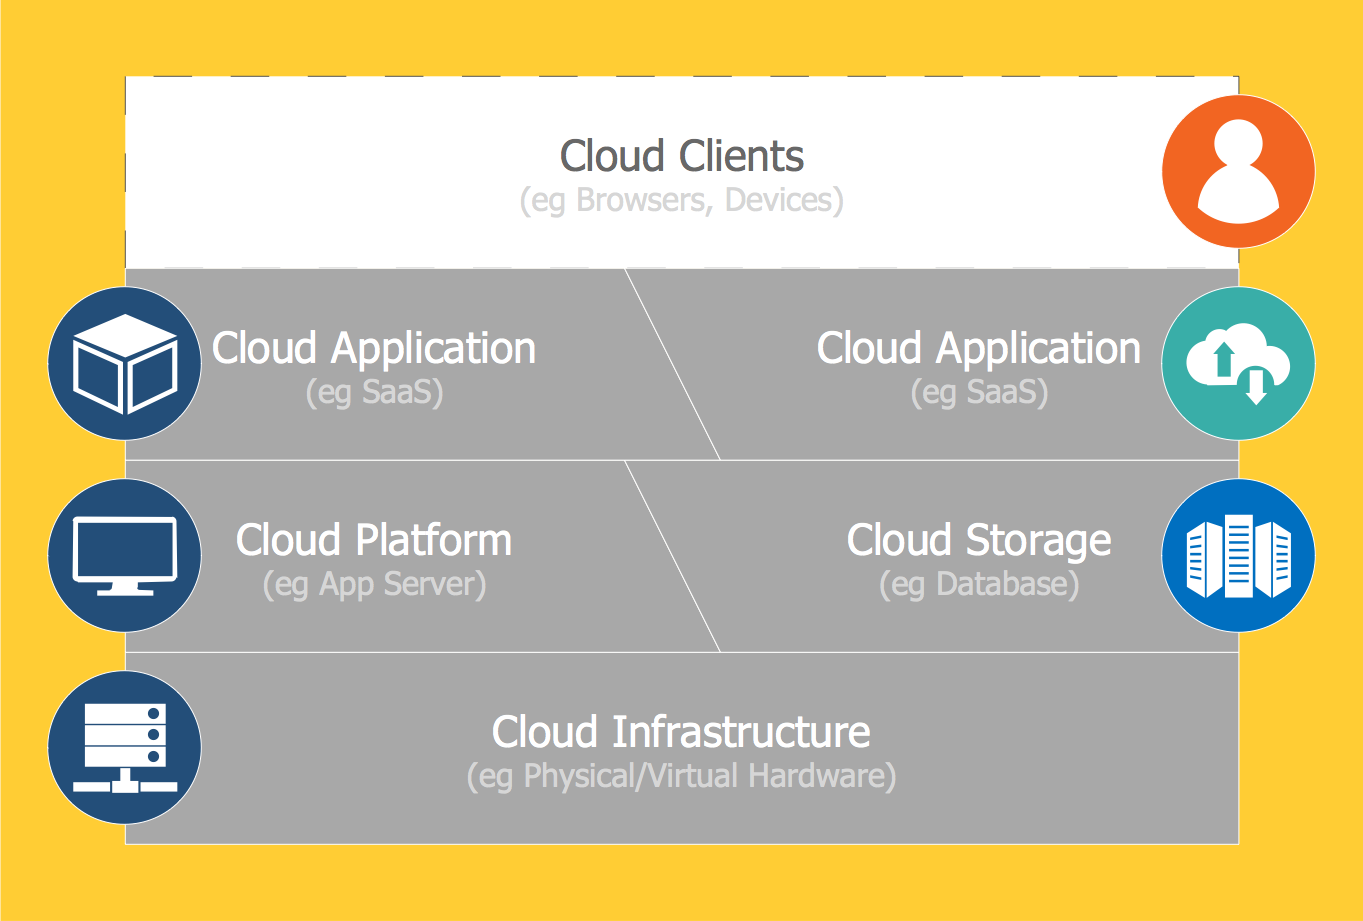
The best way to visualize the introduction to Cloud computing architecture is to create diagrams and schematics representing what is a cloud computing and how it works. For their design, we recommend to use a powerful ConceptDraw DIAGRAM diagramming and vector drawing software supplied with Cloud Computing Diagrams solution from the Computers and Network area of ConceptDraw Solution ParkEntity Relationship Diagram Software Engineering
Entity Relationship Diagram (aka ER Diagram, E-R Diagram, ERD) is a time-tested and widespread software development and software engineering method for data modeling, illustrating the logical structure of databases and system design. For ERDs construction are used three basic elements: entities, attributes, and relationships. Chen's notation for ERD supposes the use of rectangles (boxes) to represent entities and diamonds to depict relationships between first-class objects. This notation is popular when creating conceptual data models of information systems. Another standardized notation for ER diagrams is Crow's foot notation. ConceptDraw DIAGRAM as a powerful Entity Relationship Diagram software engineering provides the tools of Entity-Relationship Diagram (ERD) solution from Software Development area of ConceptDraw Solution Park for instantly describing databases using ERDs of Crow’s Foot and Chen’s notations. Use the predesigned vector elements for both these notations from 2 libraries included to Entity-Relationship Diagram (ERD) solution.Flowchart Process Example
ConceptDraw DIAGRAM is a professional software for creating great looking flowcharts. The samples included in this set of software allows users to draw any type of flowchart.- Entity-Relationship Diagram ( ERD ) | Accounting Information ...
- Erd Financial Accounting Software
- Erd For Financial Managing Accounts
- Er Diagram Of Accounting Management System
- Entity Relationship Diagram Example Related To Accounting
- How To Draw An Entity Relationship Diagram An Accounting Firm
- Entity-Relationship Diagram ( ERD ) | Er Diagram Of Financial ...
- Erd For Finance Management
- Accounting Software Data Flow Diagram
- Uml Diagram Of Accounting Software


