This site uses cookies. By continuing to browse the ConceptDraw site you are agreeing to our Use of Site Cookies.

atm solutions,uml examples, uml example, uml diagram creator, best uml tool, banking system ATM UML Diagrams

atm solutions,uml examples, uml example, uml diagram creator, best uml tool, banking system
The ATM UML Diagrams solution lets you create ATM solutions and UML examples. Use ConceptDraw DIAGRAM as a UML diagram creator to visualize a banking system.

UML Component Diagram

UML Component Diagrams are used to illustrate the structure of arbitrarily complex systems and illustrates the service consumer - service provider relationship between components.

UML Deployment Diagram Example - ATM System UML diagrams

The UML Deployment Diagram is used for visualization of elements and components of a program, that exist at the stage of its execution. It contains graphical representations of processors, devices, processes, and relationships between them. The UML Deployment Diagram allows to determine the distribution of system components on its physical nodes, to show the physical connections between all system nodes at the stage of realization, to identify the system bottlenecks and reconfigure its topology to achieve the required performance. The UML Deployment diagram is typically developed jointly by systems analysts, network engineers and system engineers. ConceptDraw DIAGRAM diagramming and vector drawing software with Rapid UML solution from Software Development area of ConceptDraw Solution Park perfectly suits for designing different types of UML diagrams, including the UML Deployment Diagrams. There are included a lot of design elements, templates, examples and samples, among them an example of work of ATM (Automated Teller Machine) banking system.

UML Component Diagram Example - Online Shopping

UML Component Diagram Online Shopping. This sample was created in ConceptDraw DIAGRAM diagramming and vector drawing software using the UML Component Diagram library of the Rapid UML Solution from the Software Development area of ConceptDraw Solution Park. This sample shows the concept of the online shopping and is used for the understanding of the online shopping processes, of the online shops working processes, for projection and creating of the online stores.

UML Deployment Diagram. Design Elements

UML Deployment diagram describes the hardware used in system implementations and the execution environments and artifacts deployed on the hardware. ConceptDraw has 393 vector stencils in the 13 libraries that helps you to start using software for designing your own UML Diagrams. You can use the appropriate stencils of UML notation from UML Deployment library.

Activity Network Diagram Method

Activity Network Diagram - This sample was created in ConceptDraw DIAGRAM diagramming and vector drawing software using the Seven Management and Planning Tools solution from the Management area of ConceptDraw Solution Park. This sample shows the PERT (Program Evaluation Review Technique) chart of the request on proposal. A request for proposal (RFP) is a request of the company or the organization to potential suppliers to submit the business proposals for service or goods that it is interested to purchase. The RFP is represented on the initial procurement stage and allows to define the risks and benefits.

Basic Audit Flowchart. Flowchart Examples

This sample shows the Audit Process Flowchart. It was created in ConceptDraw DIAGRAM diagramming and vector drawing software using the Flowcharts solution from the Diagrams area of ConceptDraw Solution Park. The Audit Flowcharts are widely used in the financial management, accounting, money management and in many others fields.

UML Deployment Diagram

UML Deployment Diagram depicts the physical deployment of artifacts on nodes (nodes are the existing hardware components, artifacts are the software components running on each node); and how the different pieces are connected. Use ConceptDraw DIAGRAM with UML deployment diagram templates, samples and stencil library from Rapid UML solution to model the physical deployment of artifacts on nodes of your software system.
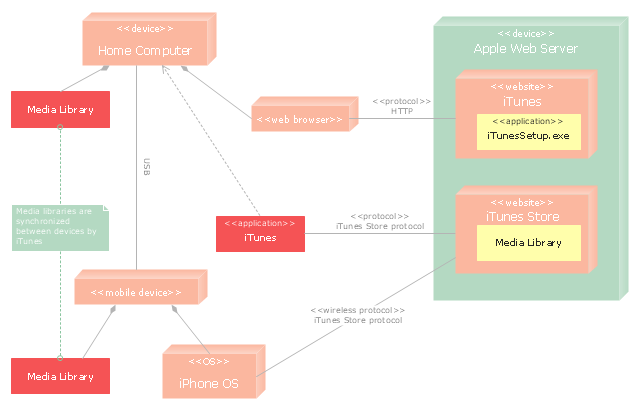
"iTunes is a media player, media library, and mobile device management application developed by Apple Inc. It is used to play, download, and organize digital audio and video on personal computers running the OS X and Microsoft Windows operating systems. The iTunes Store is also available on the iPod Touch, iPhone, and iPad.
Through the iTunes Store, users can purchase and download music, music videos, television shows, audiobooks, podcasts, movies, and movie rentals in some countries, and ringtones, available on the iPhone and iPod Touch (fourth generation onward). Application software for the iPhone, iPad and iPod Touch can be downloaded from the App Store." [iTunes. Wikipedia]
The UML deployment diagram example "Apple iTunes" was created using the ConceptDraw PRO diagramming and vector drawing software extended with the Rapid UML solution from the Software Development area of ConceptDraw Solution Park.
UML deployment diagram
UML deployment diagram, note, device, component,

UML Deployment Diagram. Diagramming Software for Design UML Diagrams

Deployment diagram describes the hardware used in system implementations and the execution environments and artifacts deployed on the hardware.

UML Class Diagram Example for GoodsTransportation System

Class Diagram for Goods Transport System in UML. This sample was created in ConceptDraw DIAGRAM diagramming and vector drawing software using the UML Class Diagram library of the Rapid UML Solution from the Software Development area of ConceptDraw Solution Park. This sample shows the concept of working of the transport company and is used by transport companies, carriers at the transportation of various goods.

Stakeholder Management System

Stakeholder management is a critical component to the successful delivery of any project, programme or activity. ConceptDraw DIAGRAM is a powerful diagramming and vector drawing software. Now, thanks to the Stakeholder Onion Diagrams Solution included to the Management Area of ConceptDraw Solution Park, ConceptDraw DIAGRAM became also unique stakeholder management system design software.

Flowchart Components

The ConceptDraw Flowchart component includes a set of samples and templates. This geathered as flowchart maker toolbox which focused on drawing flowcharts of any industry standards.

About UML

Use Case Diagram Taxi Service UML. This sample was created in ConceptDraw DIAGRAM diagramming and vector drawing software using the UML Use Case Diagram library of the Rapid UML Solution from the Software Development area of ConceptDraw Solution Park. This sample shows the work of the taxi service and is used by taxi stations, by airports, in the tourism field and delivery service.

Components of ER Diagram

Entity-Relationship model gives the possibility to visually describe a database using the components of ER Diagram, entity relationship stencils, relationship symbols, work flow shapes. ER-diagram lets represent the data or entities, attributes of these entities and relationships between them, using standardized Crow’s Foot notation icons or Chen’s notation icons. An entity is an object of the real world, it can exist independently and has the instances which differ in attribute values (properties). The attributes give an unambiguous (uniquely) identification for the instance and are called the primary key, this key can be composite and combine several attributes. ConceptDraw DIAGRAM is a professional software available with Entity-Relationship Diagram (ERD) solution from Software Development area that lets create ERDs for various database systems, using Crow’s Foot and Chen’s notations. It is invaluable tool for software engineers and developers, it supports ODBC-compatible databases (Oracle, MySQL, MS Access, MS SQL, InterBase, Firebird and others).

UML Collaboration Diagram (UML2.0)

UML Collaboration Diagram depicts the interactions between objects or parts in terms of sequenced messages and describes both the static structure and dynamic behavior of a system. Rapid UML solution provides templates, examples and libraries of stencils for quick and easy drawing all the types of system and software engineering diagrams according to UML 2.4 and 1.2 notations.

Why flowchart is important to accounting information system?

Flowcharts are used to represent accounting information in a system. There are special symbols which are used to create accounting flowcharts.

Data Flow Diagram Process

Data Flow Diagram (DFD) is a hierarchy of functional processes, connected by data flows. The purpose of this presentation is to show how each process converts its inputs into outputs and to identify relationships between these processes. DFD is convenient way of modeling and construction the information processes, it step-by-step illustrates the flow of information in a process. For construction a DFD traditionally are used two different notations, which appropriate to the methods of Yourdon-Coad and Gane-Sarson. These notations slightly different from each other by graphical representation of symbols for processes, data stores, data flow, external entities. When designing a DFD it is required to decompose the system into the components (sub-systems), for explaining a complex system you may need represent numerous levels. The Data Flow Diagrams solution from ConceptDraw Solution Park contains numerous predesigned DFD symbols for both notations, which help easy and effectively design professional-looking Data Flow Diagrams (DFDs) and DFD Process Diagrams.

UML diagram, UML modeling Rapid UML

UML diagram, UML modeling
Rapid UML solution extends ConceptDraw DIAGRAM software with templates, samples and libraries of vector stencils for quick drawing the UML diagrams using Rapid Draw technology.

Accounting Flowchart Symbols

Accounting is a well known and popular tool used for gaining full quantitative information about the finances. The accounting process includes extensive set of activities that begins with transactions and ends with closing of books. It contains all financial information for a given organization, the data about incomes, expenditures, purchases, sales, return, payroll, and many other numerical information. The excellent possibility to create great-looking Accounting Flowcharts is offered by professional ConceptDraw DIAGRAM diagramming and vector drawing software. It includes the Accounting Flowcharts solution containing wide variety of predesigned accounting flowchart symbols. All symbols are easy recognizable, commonly used, vector and professionally designed, so are capable effectively save your time and efforts when representing all stages of accounting work process, the flow of data in an organization, accounting procedures and processes, documents, tasks, responsible people, users, components and authorizations.