Diagramming Software for Design UML Activity Diagrams
Activity diagram describes the business and operational step-by-step workflows of components in a system. An activity diagram shows the overall flow of control.
UML Activity Diagram
UML Activity Diagram is a type of UML diagrams, which illustrates the business and operational step-by-step workflows of components within a system and shows the overall flow of control. UML Activity Diagram is constructed from a limited number of shapes, connected each other with arrows. The most important shape types are rounded rectangles, diamonds, bars, black circle, encircled black circle. The arrows represent the order in which activities happen and run from the start towards the end. ConceptDraw DIAGRAM software enhanced with Rapid UML solution is ideal for software designers and software developers who need to draw the UML Activity Diagrams and other types of UML diagrams. It is convenient to use the appropriate stencils of UML notation from the UML Activity library included to the Rapid UML solution of ConceptDraw Solution Park and containing a lot of specific vector UML objects. Use them to design your own UML Activity Diagrams, make them colorful and attractive with style tools of ConceptDraw DIAGRAM software.UML Activity Diagram. Design Elements
UML Activity Diagram illustrate the business and operational step-by-step workflow of components in a system and shows the overall flow of control.
UML Class Diagrams. Diagramming Software for Design UML Diagrams
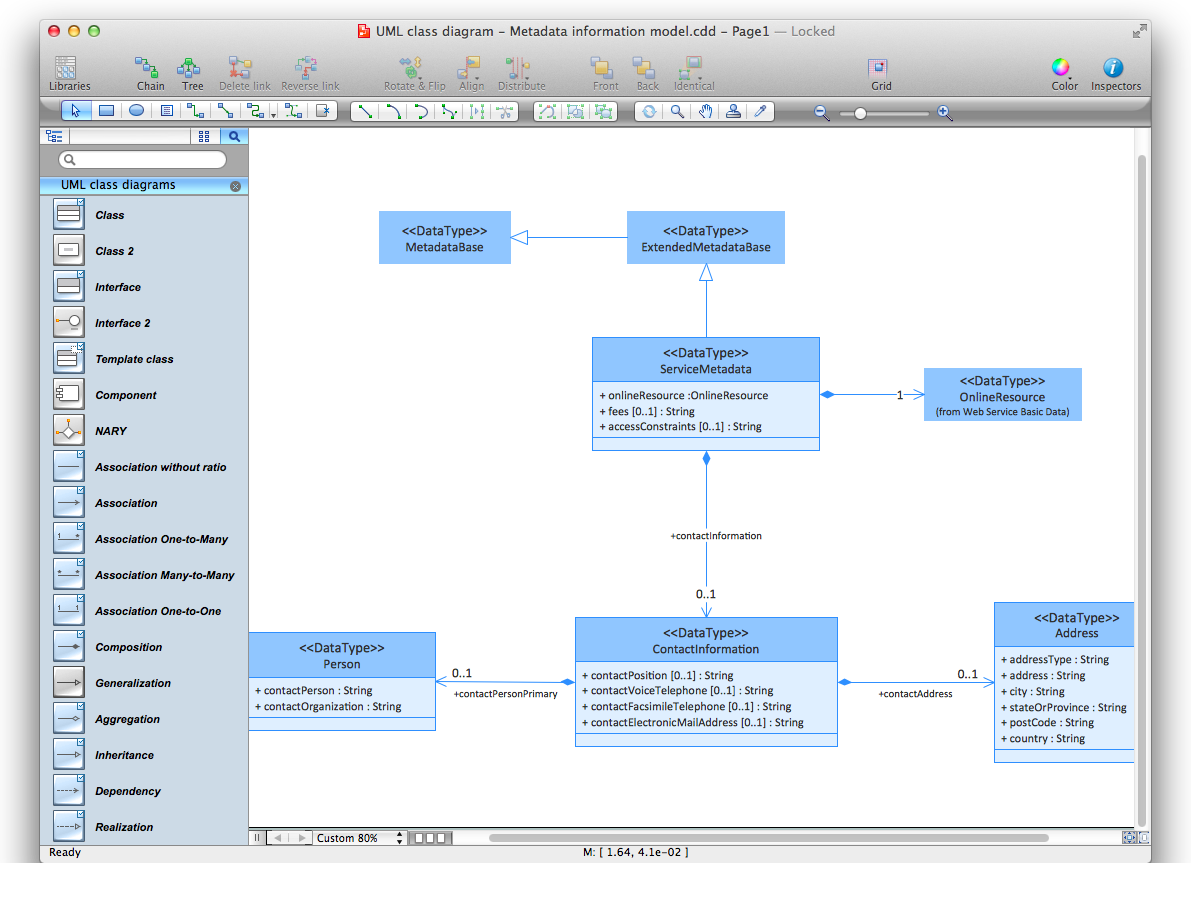
In software engineering, a UML Class Diagrams is a type of static structure diagram that is used both for general conceptual modeling of the systematics of the application, and for detailed modeling translating the models into programming code. Use ConceptDraw DIAGRAM with UML class diagram templates, samples and stencil library from Rapid UML solution to show the classes of system, their attributes, operations or methods, and the relationships among the classes.
Data Flow Diagram
Data Flow Diagram (DFD) is the part of the Structured Systems Analysis and Design Methodology (SSADM), which is intended for information systems projection and analysis. Data Flow Diagrams allow graphically represent the data flows in information system and analyze the data processing during the structural projection. This type of diagrams lets visually show a work of information system and results of this work, it is often used in connection with human processes and can be displayed as Workflow diagram. Data Flow Diagram visualizes processes and functions, external entities, data depositories, and data flows connecting these elements and indicating direction and data character. Each of these elements used for DFD has its own graphical notation. There are two notations to draw DFDs - Yourdon & Coad and Gane & Sarson. ConceptDraw DIAGRAM extended with Data Flow Diagrams (DFD) solution from Software Developmant area is ideal for designing professional looking DFDs, which can be then easily exported in various formats.Swim Lane Flowchart Symbols
Use the set of special professionally developed swim lane flowchart symbols - single, multiple, vertical and horizontal lanes from the Swimlanes and Swimlanes BPMN 1.2 libraries from the Business Process Diagram solution, the Swim Lanes library from the Business Process Mapping solution as the perfect basis for your Swim Lane Flowcharts of processes, algorithms and procedures.UML Use Case Diagram Example. Registration System
This sample was created in ConceptDraw DIAGRAM diagramming and vector drawing software using the UML Use Case Diagram library of the Rapid UML Solution from the Software Development area of ConceptDraw Solution Park. This sample shows the types of user’s interactions with the system and is used at the registration and working with the database system.Business Process Flow Diagram
Business Process Flow Diagram is a graphical presentation of business processes and process flows. It is one of the main tool of business analysis and business process re-engineering that lets identify and easy understand process flows within organization. ConceptDraw DIAGRAM extended with Business Process Workflow Diagrams solution from the Business Processes area of ConceptDraw Solution Park is a powerful software which lets easy design Business Process Flow Diagram of any complexity.Booch OOD Diagram
The vector stencils library Booch OOD from the solution Software Engineering contains specific symbols of the Booch method such as class symbols, association symbols, aggregation symbols for ConceptDraw DIAGRAM diagramming and vector drawing software. The Software Engineering solution is contained in the Software Development area of ConceptDraw Solution Park.UML Component Diagram Example - Online Shopping
UML Component Diagram Online Shopping. This sample was created in ConceptDraw DIAGRAM diagramming and vector drawing software using the UML Component Diagram library of the Rapid UML Solution from the Software Development area of ConceptDraw Solution Park. This sample shows the concept of the online shopping and is used for the understanding of the online shopping processes, of the online shops working processes, for projection and creating of the online stores.- Activity Diagram For Library Management System Ppt
- Example Activity Diagram Library Management System Pdf
- Activity Diagrams For Library Information Systems
- Activity Diagram For Library Management System In Uml
- Draw UML Activity Diagrams For Library Management System
- Library Management System Swim Lane Diagram
- Activity Diagram Of Library Management System With Object And
- Activity Diagram For Member Registration In Library System
- Swimlane Activity Diagram For Library Management System
- Activity Diagram For Library Management System In Swimlane


