Cross-Functional Flowchart
Use of Cross-Functional Flowchart is a clear way of showing each team member’s responsibilities and how processes get shared or transferred between different responsible people, teams and departments. Use the best flowchart maker ConceptDraw DIAGRAM with a range of standardized cross-functional flowchart symbols to create the Cross-Functional Flowcharts simply and to visualize the relationship between a business process and the functional units responsible for that process. To draw the most quickly Cross-Functional Flowcharts, Cross Functional Process Maps, or Cross Functional Process Flow Diagrams, start with a Cross-functional flowchart samples and templates from ConceptDraw Solution Park. The ConceptDraw Arrows10 and RapidDraw technologies will be also useful for you in drawing. ConceptDraw DIAGRAM supports designing both types - horizontal and vertical Cross-functional flowcharts. A vertical layout makes the accents mainly on the functional units while a horizontal layout - on the process. If you need a Visio alternative in Mac OS X, try ConceptDraw DIAGRAM. Its interface is very intuitive and it’s actually much easier to use than Visio, yet somehow it’s just as powerful if not more so. ConceptDraw DIAGRAM performs professional quality work and seamless Visio interaction.
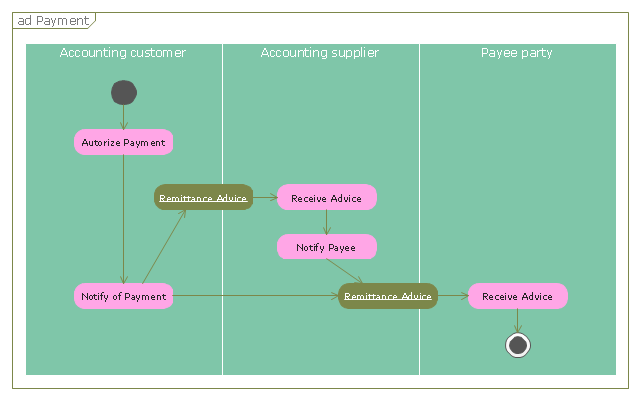
"A payment is the transfer of an item of value from one party (such as a person or company) to another in exchange for the provision of goods, services or both, or to fulfill a legal obligation. ...
Payment methods.
There are two types of payment methods; exchanging and provisioning. Exchanging is to change coin, money and banknote in terms of the price. Provisioning is to transfer money from one account to another. In this method, a third party must be involved. Credit card, debit card, Cheques, money transfers, and recurring cash or ACH (Automated Clearing House) disbursements are all electronic payments methods. Electronic payments technologies are magnetic stripe card, smartcard, contactless card and mobile handset. Mobile handset based payments are called mobile payments." [Payment. Wikipedia]
The UML activity diagram example "Payment process" was created using the ConceptDraw PRO diagramming and vector drawing software extended with the Rapid UML solution from the Software Development area of ConceptDraw Solution Park.
 Logistics Flow Charts
Logistics Flow Charts solution extends ConceptDraw DIAGRAM functionality with opportunities of powerful logistics management software. It provides large collection of predesigned vector logistic symbols, pictograms, objects and clipart to help you design with pleasure Logistics flow chart, Logistics process flow diagram, Inventory flow chart, Warehouse flowchart, Warehouse management flow chart, Inventory control flowchart, or any other Logistics diagram. Use this solution for logistics planning, to reflect logistics activities and processes of an enterprise or firm, to depict the company's supply chains, to demonstrate the ways of enhancing the economic stability on the market, to realize logistics reforms and effective products' promotion.
 Area Charts
Area Charts are used to display the cumulative totals over time using numbers or percentages; or to show trends over time among related attributes. The Area Chart is effective when comparing two or more quantities. Each series of data is typically represented with a different color, the use of color transparency in an object’s transparency shows overlapped areas and smaller areas hidden behind larger areas.
 HR Flowcharts
Human resource management diagrams show recruitment models, the hiring process and human resource development of human resources.
 Line Graphs
How to draw a Line Graph with ease? The Line Graphs solution extends the capabilities of ConceptDraw DIAGRAM with professionally designed templates, samples, and a library of vector stencils for drawing perfect Line Graphs.
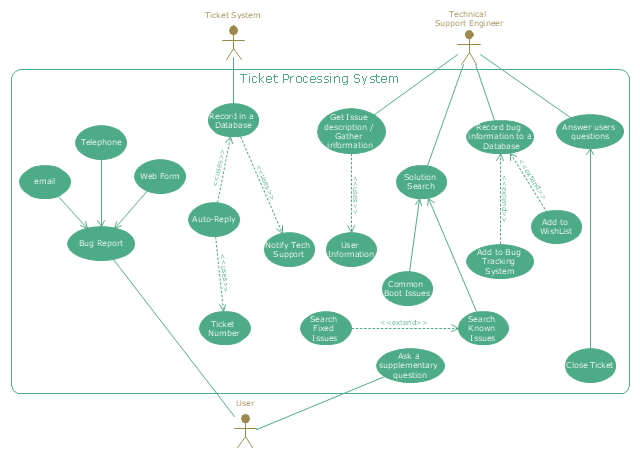
"An example scenario is presented to demonstrate how a common issue tracking system would work:
(1) A customer service technician receives a telephone call, email, or other communication from a customer about a problem. Some applications provide built-in messaging system and automatic error reporting from exception handling blocks.
(2) The technician verifies that the problem is real, and not just perceived. The technician will also ensure that enough information about the problem is obtained from the customer. This information generally includes the environment of the customer, when and how the issue occurs, and all other relevant circumstances.
(3) The technician creates the issue in the system, entering all relevant data, as provided by the customer.
(4) As work is done on that issue, the system is updated with new data by the technician. Any attempt at fixing the problem should be noted in the issue system. Ticket status most likely will be changed from open to pending.
(5) After the issue has been fully addressed, it is marked as resolved in the issue tracking system.
If the problem is not fully resolved, the ticket will be reopened once the technician receives new information from the customer. A Run Book Automation process that implements best practices for these workflows and increases IT personnel effectiveness is becoming very common." [Issue tracking system. Wikipedia]
The UML use case diagram example "Ticket processing system" was created using the ConceptDraw PRO diagramming and vector drawing software extended with the Rapid UML solution from the Software Development area of ConceptDraw Solution Park.
- Activity Diagram For Online Admission System
- Class Diagram For Online Admission In University
- Activity Diagram For Admission Process
- UML Use Case Diagram Example Registration System | Process ...
- Class Diagram For Admission System
- Draw Data Flow Diagram For The Admission System
- New Student Admission In A Colage Draw A Class Diagram Using
- UML Use Case Diagram Example Registration System | Daigram Of ...
- How To Draw Entity Relationship Diagram About Admission System
- UML Use Case Diagram Example Registration System | Use Case ...
- Class Diagram For College Admission System
- Class Diagram For University Admission System
- Simple & Fast Diagram Software | Flowchart Maker | Example of ...
- Create A Use Case Diagram For University Management System
- Class Diagram For Student Admission System
- Use Case Diagram For Admission System
- Draw A 0 Level And 1 Level Dfd Of A Online Admission System
- Credit Card Processing System UML Diagram | UML Use Case ...
- DFD Library System | Data Flow Diagram Symbols. DFD Library ...
- Er Diagram For News Management System


