Activity Network (PERT) Chart
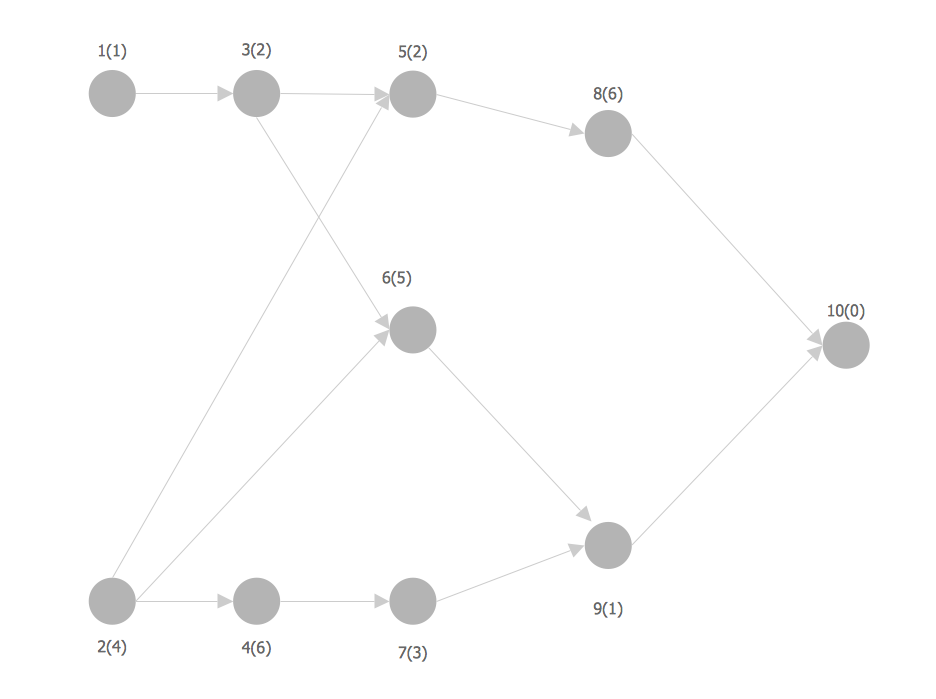
Activity Network and Project Evaluation and Review Technique, or PERT, charts are a way of documenting and analyzing the tasks in a project. This diagram is constructed as part of the process in creating a schedule of corrective actions. The Activity Network Chart (PERT) shows the logical connections and consequence of tasks to be performed. It displays the time period for problem solving and the implementation of all activities through the critical path.Activity on Node Network Diagramming Tool
Activity on Node Network Diagramming Tool — Activity Network and Project Evaluation and Review Technique, or PERT, charts are a way of documenting and analyzing the tasks in a project. This sample shows the Activity on node network diagramming method. It was created in ConceptDraw DIAGRAM diagramming and vector drawing software using the Seven Management and Planning Tools solution from the Management area of ConceptDraw Solution Park.Activity Network Diagram Method
Activity Network Diagram - This sample was created in ConceptDraw DIAGRAM diagramming and vector drawing software using the Seven Management and Planning Tools solution from the Management area of ConceptDraw Solution Park. This sample shows the PERT (Program Evaluation Review Technique) chart of the request on proposal. A request for proposal (RFP) is a request of the company or the organization to potential suppliers to submit the business proposals for service or goods that it is interested to purchase. The RFP is represented on the initial procurement stage and allows to define the risks and benefits.Network Analysis Activity on Node
This sample shows the activity on node (AON) network. The social network analysis (SNA) is the analysis of the social networks, it analyzes the social relationships in terms of network theory that uses nodes and ties. The nodes represent the activities and are displayed as circles labeled with the activity number and completion time in brackets. The nodes are sequentially connected, the ties are represented as lines.Computer Networking Tools List
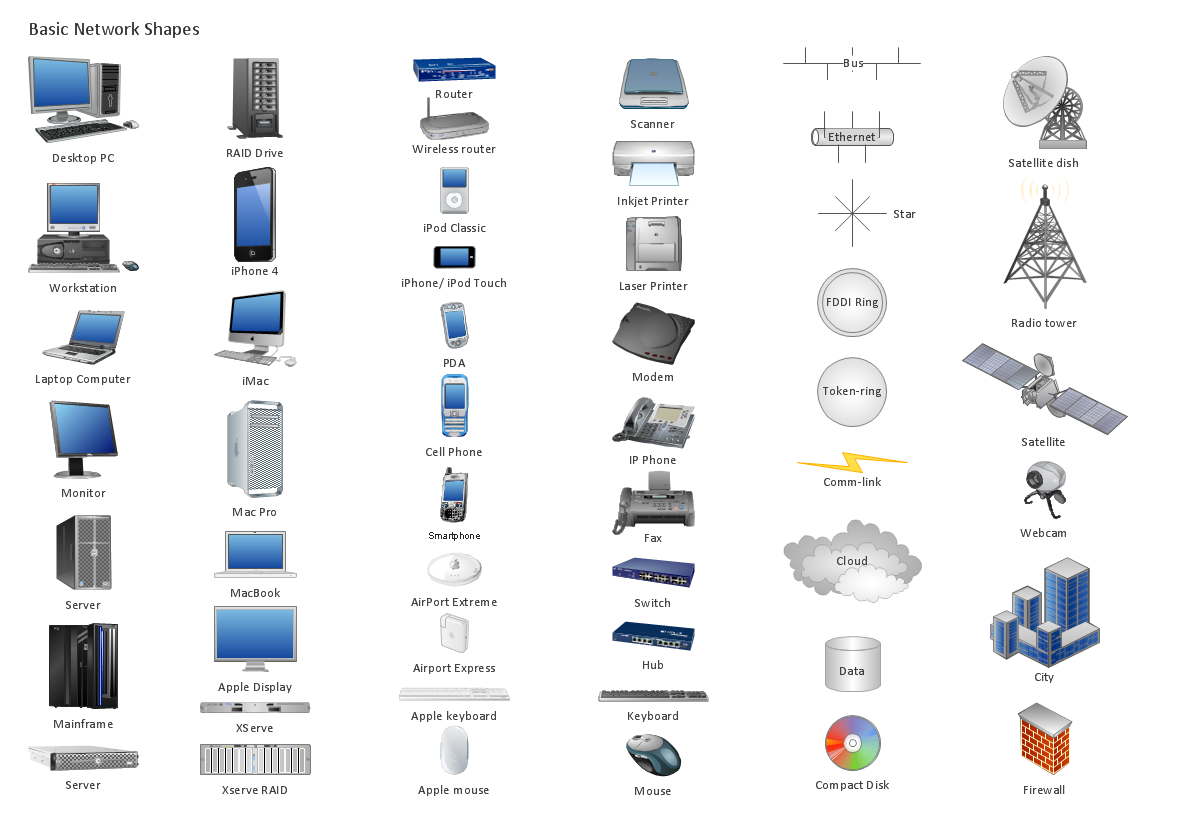
Network Diagrams visualize schematically the computer networks topology, equipment nodes and different types of their logical and physical connections. They are widely used by IT professionals to visually document the topology and design of computer and telecommunication networks.Physical Activity Plan
The physical activity is one of the key aspects of a healthy lifestyle. It makes a person not only more attractive physically, but also significantly improves his health, positively affects the life's duration, reduces the chances of appearance the serious diseases. This can be a serious sports occupation, but it is not necessary, the moderate physical activity is also very useful and important for everyone. It can be any muscle activity performed during the day, week, month, or year, no matter these are the special physical exercises, dancing, housework, working in the garden, climbing stairs, or just walking. The physical activity has a particular importance for children's health. The exercises and physical activity allow children to prevent development of various chronic diseases and heart illnesses yet at early age, promotes healthy and harmonious child's development, physical, mental and intellectual. The Mind Map designed in ConceptDraw MINDMAP software depicts detailed activity plan, which illustrates the proposal to incorporate more physical activity into a college community.Rack Rate
The Rack Diagram visualizes in details the rack mounting of computer and network equipment, so it allows to show what equipment and racks are needed to buy, allows to estimate the rack rate and also helps to organize equipment on the racks virtually, without the real installation. To facilitate the rack diagrams designing, ConceptDraw DIAGRAM diagramming and vector drawing software was extended with Rack Diagrams Solution from the Computer and Networks Area.Network Topologies
Network topology is a topological structure of computer network, which can be physical or logical. The physical topology depicts location of different computer network elements such as computers, cables and other devices. The logical topology visually displays network dataflows from one device to another. Sometimes network logical and physical topologies can be the same. ConceptDraw DIAGRAM diagramming and vector drawing software is powerful for drawing network maps and network topologies diagrams of any kinds and complexity thanks to the Computer Network Diagrams solution from the Computer and Networks area. ConceptDraw STORE proposes collection of network icons libraries and a lot of Network Topology Diagram examples, samples and templates which were created at ConceptDraw DIAGRAM software specially for Computer Network Diagrams solution. There are six basic types of the network topologies: Bus, Star, Ring, Mesh, Tree, Fully Connected. You can fast and easy design professional-looking diagram for each of them using the ConceptDraw DIAGRAM tools. There are plenty of web Visio-like diagramming software available. Web based diagrams software can be powerful, but sometimes it is essential to have desktop software. One of the most advanced diagrams tools like Visio for Mac OS is ConceptDraw DIAGRAM app.
UML Use Case Diagram Example. Social Networking Sites Project
UML Diagrams Social Networking Sites Project. This sample was created in ConceptDraw DIAGRAM diagramming and vector drawing software using the UML Use Case Diagram library of the Rapid UML Solution from the Software Development area of ConceptDraw Solution Park. This sample shows the Facebook Socio-health system and is used at the projection and creating of the social networking sites.- Activity Networks And Bar Charts
- Activity Network Diagram Method | Activity on Node Network ...
- Activity Network Diagram Method | PERT Chart Software | Activity on ...
- Activity on Node Network Diagramming Tool | Network Analysis ...
- Activity Network (PERT) Chart | MS Visio Look a Like Diagrams ...
- Activity Diagram For Social Networking Website
- A Task Network Diagram In Soft Project Management
- Activity Network Diagram Method | Project Timeline | Draw Network ...
- Activity Network Diagram Method | Data structure diagram with ...
- Activity Network (PERT) Chart | Activity Network Diagram Method ...


