Activity on Node Network Diagramming Tool
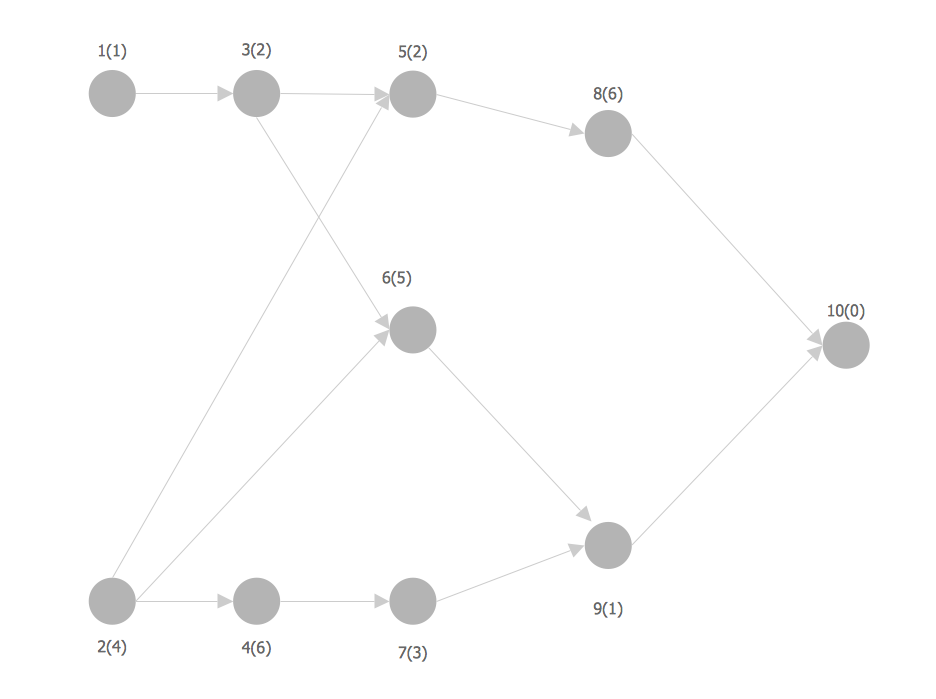
Activity on Node Network Diagramming Tool — Activity Network and Project Evaluation and Review Technique, or PERT, charts are a way of documenting and analyzing the tasks in a project. This sample shows the Activity on node network diagramming method. It was created in ConceptDraw DIAGRAM diagramming and vector drawing software using the Seven Management and Planning Tools solution from the Management area of ConceptDraw Solution Park.Network Analysis Activity on Node
This sample shows the activity on node (AON) network. The social network analysis (SNA) is the analysis of the social networks, it analyzes the social relationships in terms of network theory that uses nodes and ties. The nodes represent the activities and are displayed as circles labeled with the activity number and completion time in brackets. The nodes are sequentially connected, the ties are represented as lines.Activity Network Diagram Method
Activity Network Diagram - This sample was created in ConceptDraw DIAGRAM diagramming and vector drawing software using the Seven Management and Planning Tools solution from the Management area of ConceptDraw Solution Park. This sample shows the PERT (Program Evaluation Review Technique) chart of the request on proposal. A request for proposal (RFP) is a request of the company or the organization to potential suppliers to submit the business proposals for service or goods that it is interested to purchase. The RFP is represented on the initial procurement stage and allows to define the risks and benefits.Activity Network (PERT) Chart
Activity Network and Project Evaluation and Review Technique, or PERT, charts are a way of documenting and analyzing the tasks in a project. This diagram is constructed as part of the process in creating a schedule of corrective actions. The Activity Network Chart (PERT) shows the logical connections and consequence of tasks to be performed. It displays the time period for problem solving and the implementation of all activities through the critical path.Computer Networking Tools List
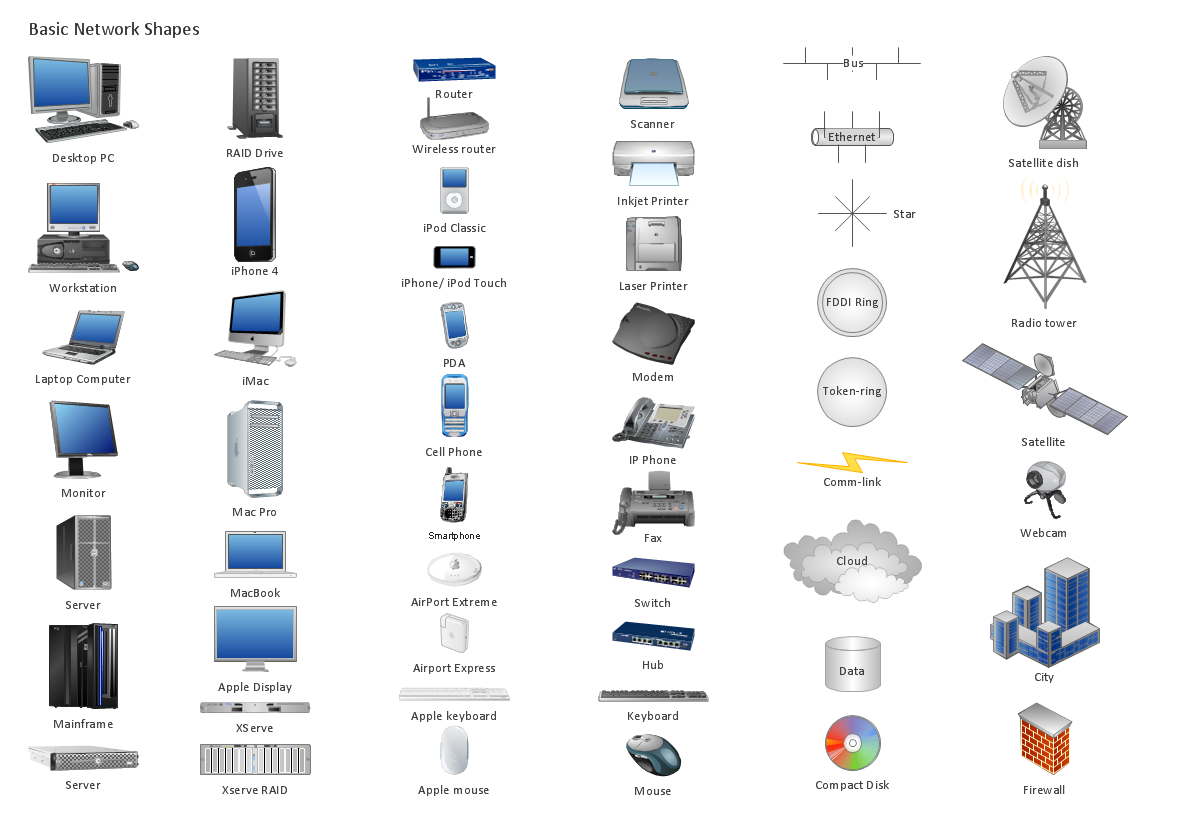
Network Diagrams visualize schematically the computer networks topology, equipment nodes and different types of their logical and physical connections. They are widely used by IT professionals to visually document the topology and design of computer and telecommunication networks.Mesh Network Topology Diagram
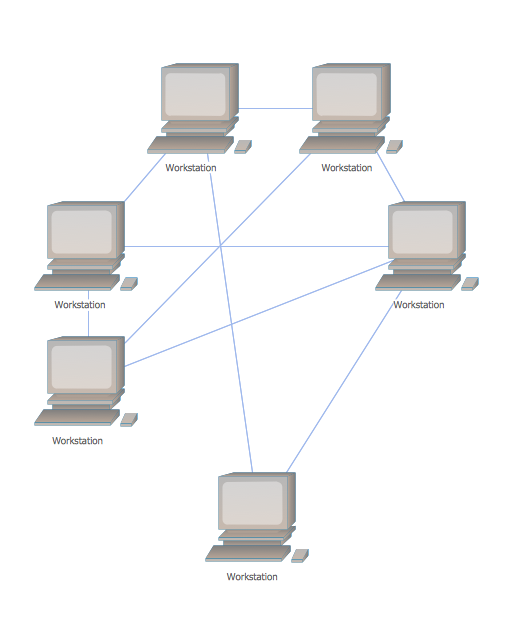
A Mesh Network Topology is a computer network topology built on the principle of cells. The network workstations are the mesh nodes, they are connected to each other, usually to the principle "each with each" (a fully connected network) and interact in the distribution of data in a network. Each node relays the data for the network and can take the role of switch for other participants. Mesh Network Topology is sufficiently complex to configure, but however it provides a high fault tolerance, has a capability for self-healing and is considered as quite reliable. Large number of nodes' connections assures a wide selection of route of following the traffic within a network, therefore the breaking of one connection will not disrupt the functioning of network as a whole. As a rule, the Mesh Networks are wireless. The Mesh Network Topology Diagrams of any complexity and Wireless Mesh Network Diagrams are easy for construction in ConceptDraw DIAGRAM diagramming and vector drawing software using the tools of Computer Network Diagrams solution from Computer and Networks area.Network Topologies
Network topology is a topological structure of computer network, which can be physical or logical. The physical topology depicts location of different computer network elements such as computers, cables and other devices. The logical topology visually displays network dataflows from one device to another. Sometimes network logical and physical topologies can be the same. ConceptDraw DIAGRAM diagramming and vector drawing software is powerful for drawing network maps and network topologies diagrams of any kinds and complexity thanks to the Computer Network Diagrams solution from the Computer and Networks area. ConceptDraw STORE proposes collection of network icons libraries and a lot of Network Topology Diagram examples, samples and templates which were created at ConceptDraw DIAGRAM software specially for Computer Network Diagrams solution. There are six basic types of the network topologies: Bus, Star, Ring, Mesh, Tree, Fully Connected. You can fast and easy design professional-looking diagram for each of them using the ConceptDraw DIAGRAM tools. There are plenty of web Visio-like diagramming software available. Web based diagrams software can be powerful, but sometimes it is essential to have desktop software. One of the most advanced diagrams tools like Visio for Mac OS is ConceptDraw DIAGRAM app.
Preventive Action
Preventive Action - ConceptDraw Office suite is a software for the Preventive Action making. The Seven Management and Planning Tools solution is a set of such tools for problems preventive actions via investigating of the core problem. Skilled use of these diagrams makes collaborative teamwork both more engaging and more effective.
PERT Chart Software
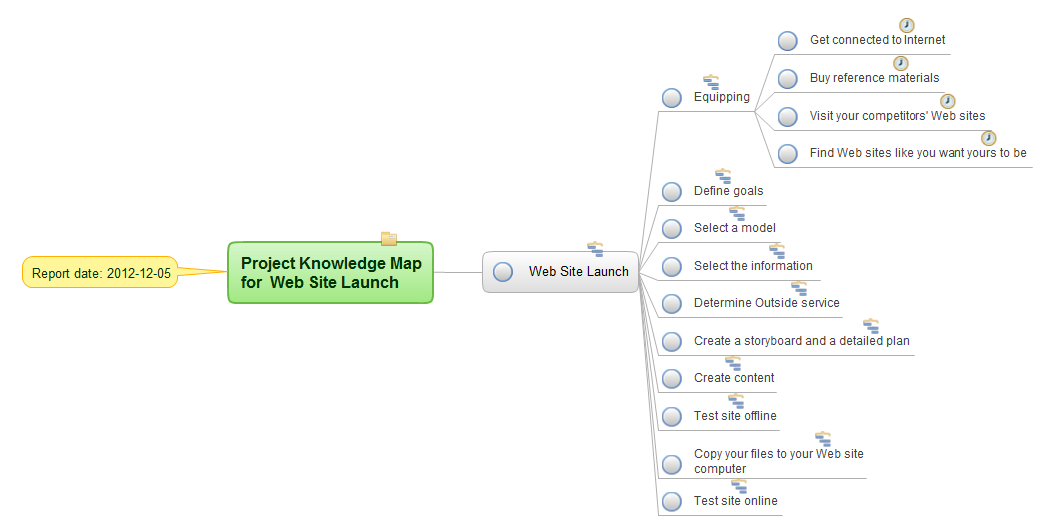
PERT Chart Software - Activity Network and Project Evaluation and Review Technique, or PERT, charts are a way of documenting and analyzing the tasks in a project. ConceptDraw DIAGRAM is a powerful diagramming and vector drawing software for designing professional looking PERT Charts quick and easy.Create Response Charts
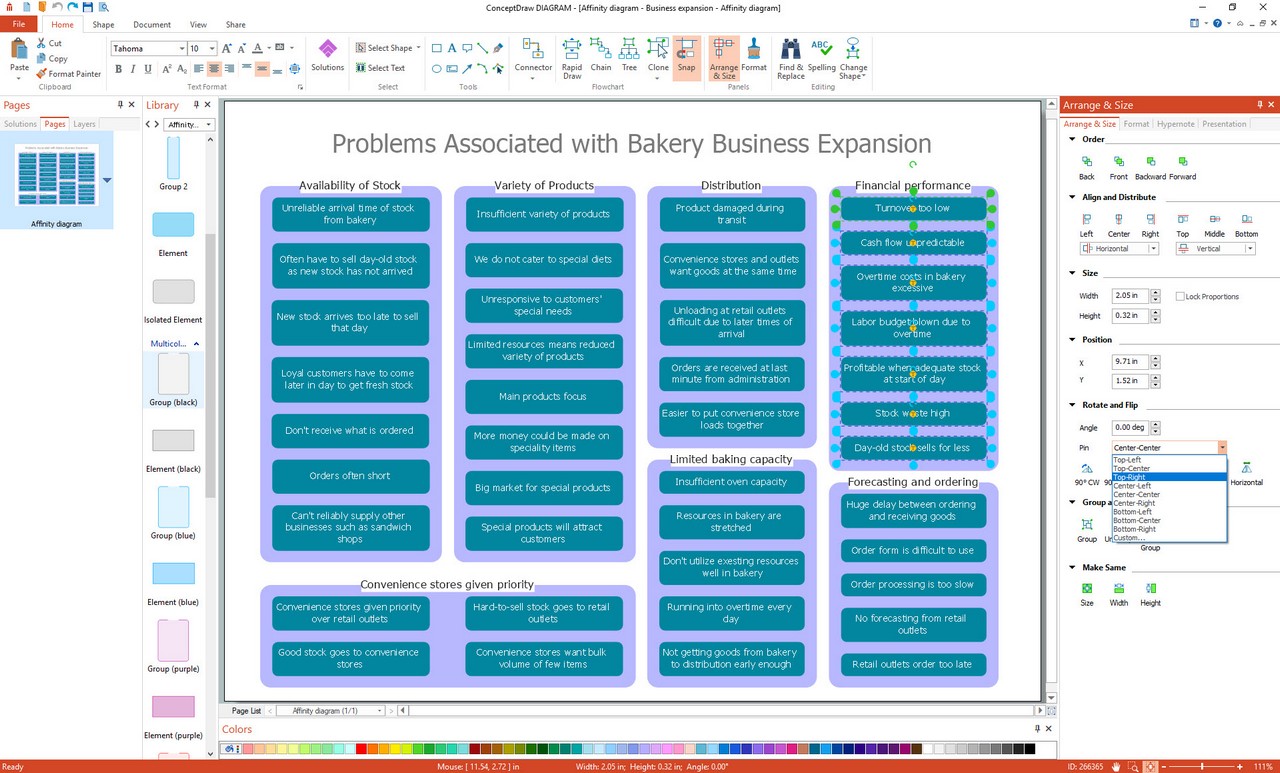
Visual navigation through the stages of a response process helps you locate specific actions to be taken via Action Mind Maps. Use ConceptDraw DIAGRAM and ConceptDraw MINDMAP for organize the process of response for interactions occurring in social media.Affinity Diagram Software
Affinity Diagram Software - ConceptDraw DIAGRAM is a powerful diagramming and vector drawing software that allows quick, easy and effective create the Affinity Diagrams. Seven Management and Planning Tools solution from the Business Productivity area of ConceptDraw Solution Park provides templates, samples and ready-to-use vector stencils that will help you design the professional looking Affinity Diagrams in a few moments.Gantt charts for planning and scheduling projects
ConceptDraw PROJECT is an excellent simple project scheduling software. It maintain classic project gantt charts and the line of professional reports on resources usage. It include handy critical path scheduling software tools and diagraming tools which helps prepare the presentation of project status. It include project tracking dashboard to keep project metrics upto date, also it have handy feature to export project management dashboard in excel file.SysML
Systems Modeling Language (SysML) is a general-purpose modeling language for systems engineering applications. ConceptDraw DIAGRAM diagramming and vector drawing software was extended with SysML Solution from the Software Development Area of ConceptDraw Solution Park specially to help systems engineers design various model systems with SysML.How To Use Collaboration Tool in Project Management
Collaboration tool for project management enables you to give a new role to knowledge management and document sharing within your team.
- Activity on Node Network Diagramming Tool | Network Analysis ...
- Project — Working With Costs | Activity Network Diagram Method ...
- Activity on Node Network Diagramming Tool | UML Activity Diagram ...
- Activity on Node Network Diagramming Tool | ConceptDraw PRO ...
- Activity on Node Network Diagramming Tool | How To Create a MS ...
- Activity on Node Network Diagramming Tool | Program Evaluation ...
- Activity on Node Network Diagramming Tool | PERT chart ...
- Activity on Node Network Diagramming Tool | Activity Network ...
- Activity on Node Network Diagramming Tool | Activity Network ...
- Network Analysis Activity on Node | Activity on Node Network ...
- Examples of Flowcharts, Org Charts and More | Activity on Node ...
- UML Activity Diagram | Activity on Node Network Diagramming Tool ...
- ConceptDraw PRO Network Diagram Tool | Activity on Node ...
- Activity on Node Network Diagramming Tool | Examples of ...
- Activity Network Diagram Method | Local area network (LAN ...
- Activity Network (PERT) Chart | Activity on Node Network ...
- Activity on Node Network Diagramming Tool | UML Deployment ...
- UML Deployment Diagram | Activity on Node Network Diagramming ...
- Network Layout | Cisco Network Diagram Software | Activity on Node ...
- Activity Network Diagram Method | Activity on Node Network ...

