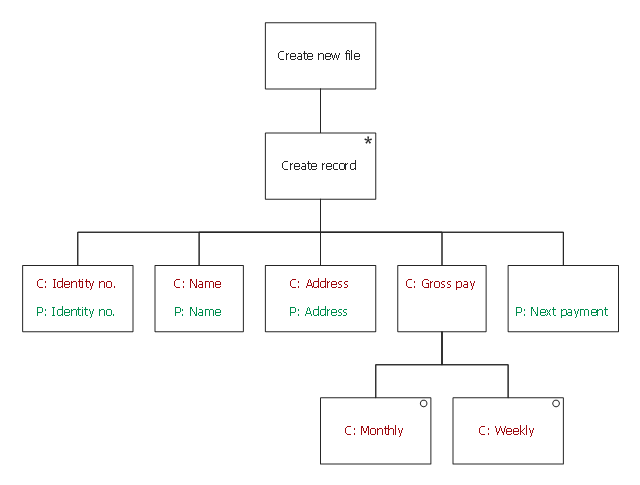
This Jackson structured programming diagram sample depicts structure of Christmas and New Year payment program.
This example was drawn on the base of the JSP diagram on the p.15 in the §8 Slides on Jackson Structured Programming (JSP) by Philip Jackson from the the EE2.sad Software Analysis & Design website of the University of Surrey.
"Example:
A company gives its work force a long break at Christmas and New Year, but does not want to provide pay in advance. So to pay its workers during the break it must post cheques to their home addresses. The Company employs people both on a permanent and a part-time basis. Permanent employees are paid monthly and part-time workers are paid weekly. All employees have a unique staff identity number, allocated to them when they join the company. ...
Input and output structures
Input 1: Finance department provides a payments file
Input 2: Personnel department provides personal details
Output: Information needed for each posted cheque" [info.ee.surrey.ac.uk/ Teaching/ Courses/ ee2.sad/ s14sad.pdf]
The Jackson structured programming diagram example "JSP diagram - Payment" was designed using ConceptDraw PRO software extended with solution from the
Software Development area of ConceptDraw Solution Park.
How to Make an Accounting Process Flowchart
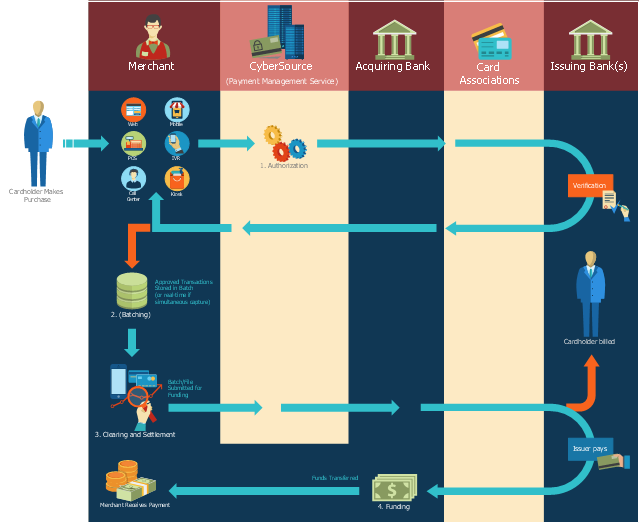
Tips on how to make an accounting flowchart. Describing methods and symbols that are used to represent the accounting system.This payment process flowchart example was created on the base of the diagram of payment process using Global Payment Processing Services from the U.S. Securities and Exchange Commission website.
"Global Payment Processing Services. CyberSource Advanced enables merchants to accept payments made by all major credit and debit cards including American Express®, Discover®, Diners Club International®, JCB, MasterCard®, and Visa® cards. Our customers can also accept payment by corporate procurement cards, electronic checks, PayPal® Express Checkout, and the Bill Me Later® service. Merchants that have business models based on subscriptions can utilize the CyberSource recurring billing service with automated account updating services. For merchants selling internationally, we support direct debit, and bank transfers, as well as regional card brands such as Carte Bleue, Carta Si, Dankort, Laser, Solo, and Visa Electron. We provide these services for online, call center, kiosk, integrated voice response (“IVR”), and IP-enabled point of sale (“POS”) transactions."
[www.sec.gov/ Archives/ edgar/ data/ 934280/ 000119312510042764/ d10k.htm]
The flowchart example "Global Payment Solutions" was created using the ConceptDraw PRO diagramming and vector drawing software extended with the Sales Flowcharts solution from the Marketing area of ConceptDraw Solution Park.
HelpDesk
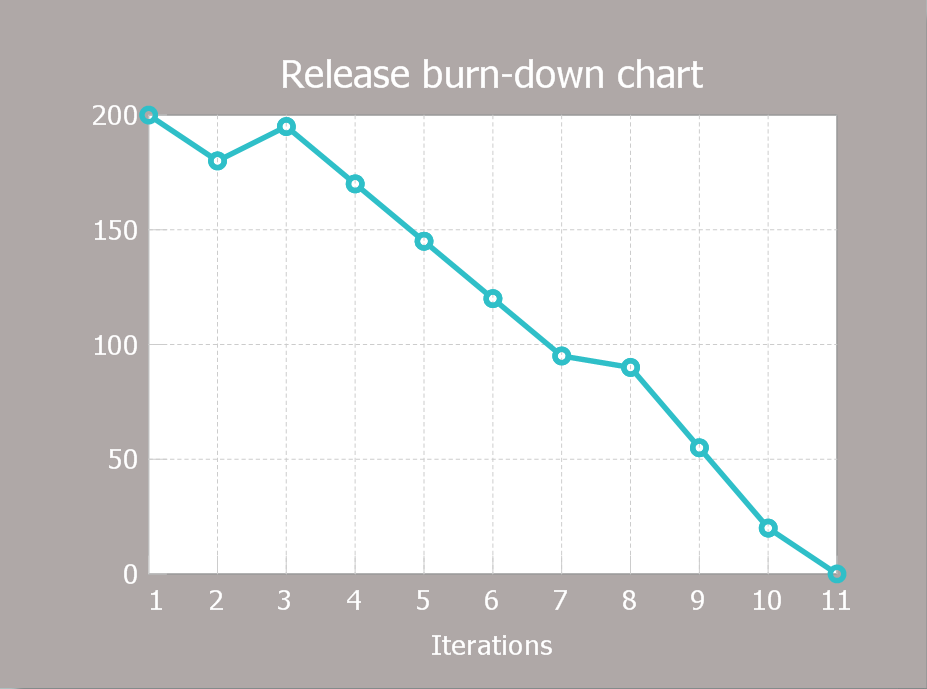
How to Create a Release Burn-Down Chart
The Agile methodology provides project teams the ability to quickly adapt the project to the current situation and thus achieve maximum productivity. According the Scrum method the steps needed to fulfill the project goal breaks down by using short sprints or iterations. The iterations together with an extensive collaboration can increase productivity by better understanding the entire flow of a project. A release burn-down chart is used to track a progress on a Scrum project. The ConceptDraw Scrum Workflow Solution makes it easy for Agile project team to build any professional Scrum diagram such as a Release velocity chart, Release burn-down chart, Sprint burn-down chart, or a Team velocity chart.Accounting Flowchart Purchasing Receiving Payable and Payment
Accounting flowchart is a pictorial way to represent the flow of data in an organization and the flow of transactions process in a specific area of its accounting or financial department. Accounting Flowcharts solution contains the full set of standardized accounting flowchart symbols which will help you design in minutes various types of Accounting Flowcharts including such popular diagrams which represent the whole accounting process: Purchasing Flowchart, Receiving Flowchart, Voucher Payable Flowchart, Treasurer Flowchart, Payment Flowchart.HelpDesk
ConceptDraw PROJECT: Filter Tasks and Resources on Mac
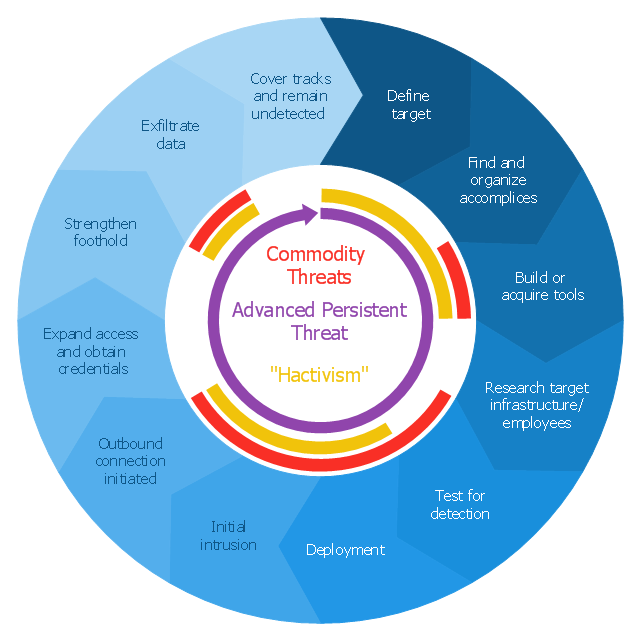
Filtering project data offers two important possibilities: to find out a required task quickly and to group tasks by various parameters to aid gathering information regarding the project status. Filtering allows you to focus on working with specific tasks, projects or resources. With ConceptDraw Project, you can filter project data on Mac OS X so that you only see the information that’s most important to you.This circular arrows diagram sample shows advanced persistent threat lifecycle.
It was designed on the base of the Wikimedia Commons file: Advanced persistent threat lifecycle.jpg.
[commons.wikimedia.org/ wiki/ File:Advanced_ persistent_ threat_ lifecycle.jpg]
This file is licensed under the Creative Commons Attribution-Share Alike 3.0 Unported license. [creativecommons.org/ licenses/ by-sa/ 3.0/ deed.en]
"Advanced Persistent Threat (APT) APT is a set of stealthy and continuous hacking processes often orchestrated by human targeting a specific entity. APT usually targets organizations and or nations for business or political motives. APT processes require high degree of covertness over a long period of time. As the name implies, APT consists of three major components/ processes: advanced, persistent, and threat. The advanced process signifies sophisticated techniques using malware to exploit vulnerabilities in systems. The persistent process suggests that an external command and control is continuously monitoring and extracting data off a specific target. The threat process indicates human involvement in orchestrating the attack.
APT usually refers to a group, such as a government, with both the capability and the intent to persistently and effectively target a specific entity. The term is commonly used to refer to cyber threats, in particular that of Internet-enabled espionage using a variety of intelligence gathering techniques to access sensitive information, but applies equally to other threats such as that of traditional espionage or attack. Other recognized attack vectors include infected media, supply chain compromise, and social engineering. Individuals, such as an individual hacker, are not usually referred to as an APT as they rarely have the resources to be both advanced and persistent even if they are intent on gaining access to, or attacking, a specific target." [Advanced persistent threat. Wikipedia]
The arrow donut chart example
"Advanced persistent threat lifecycle" was created using the ConceptDraw PRO diagramming and vector drawing software extended with the Circular Arrows Diagrams solution from the area "What is a Diagram" of ConceptDraw Solution Park.
Data Flow Diagram Process
Data Flow Diagram (DFD) is a hierarchy of functional processes, connected by data flows. The purpose of this presentation is to show how each process converts its inputs into outputs and to identify relationships between these processes. DFD is convenient way of modeling and construction the information processes, it step-by-step illustrates the flow of information in a process. For construction a DFD traditionally are used two different notations, which appropriate to the methods of Yourdon-Coad and Gane-Sarson. These notations slightly different from each other by graphical representation of symbols for processes, data stores, data flow, external entities. When designing a DFD it is required to decompose the system into the components (sub-systems), for explaining a complex system you may need represent numerous levels. The Data Flow Diagrams solution from ConceptDraw Solution Park contains numerous predesigned DFD symbols for both notations, which help easy and effectively design professional-looking Data Flow Diagrams (DFDs) and DFD Process Diagrams.How to Discover Critical Path on a Gantt Chart
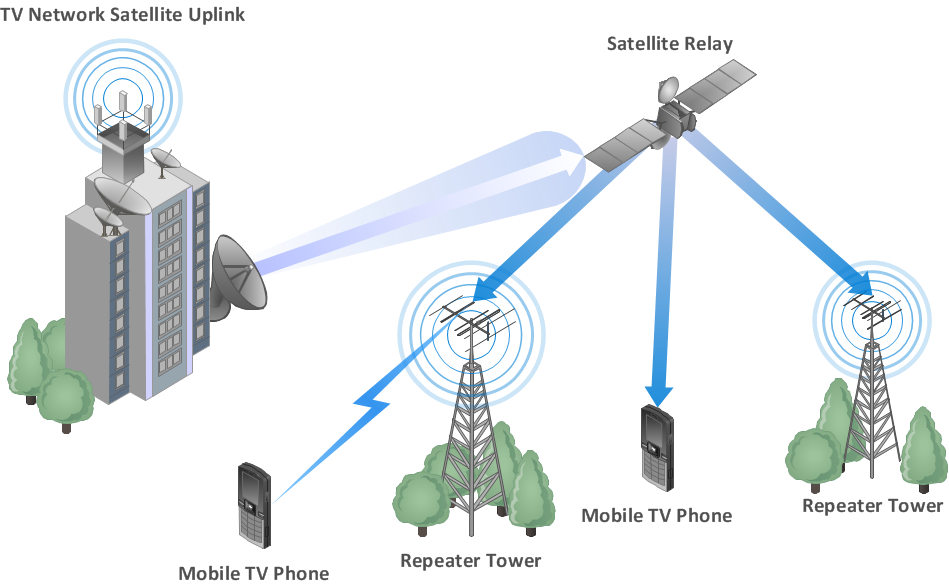
ConceptDraw PROJECT is the Gantt chart software that implements critical path method to provide the user with a wide set of project management tools.Wireless Network WAN
Wireless Networks solution from ConceptDraw Solution Park extends ConceptDraw DIAGRAM diagramming and vector drawing software to help network engineers and designers efficiently design, create and illustrate WAN network diagram of any complexity. The ConceptDraw DIAGRAM software helps users to quickly transit from an idea to the implementation of a Wireless Network WAN- Invoice payment process - Flowchart | UML component diagram ...
- Credit Card Payment Activity Diagram
- Credit Card Uml Diagrams
- How To Create Advance Powerpoint Presentations On A Mac
- UML use case diagram - Banking system | UML Deployment ...
- Invoice payment process - Flowchart | Accounting Flowchart ...
- Global Payment Solutions | Data Flow Diagrams (DFD) | Payment ...
- Accounting Flowchart Purchasing Receiving Payable and Payment ...
- Invoice payment process - Flowchart | Accounting Flowchart ...
- Invoice payment process - Flowchart | Flow Diagram Software | Flow ...
