Structured Systems Analysis and Design Method. SSADM with ConceptDraw DIAGRAM
Structured Systems Analysis and Design Method (abbr. SSADM) is a method developed in Great Britain and accepted in 1993 as a national standard for information systems development and analysis. SSADM is based on Data Flow Diagrams and is characterized with presence of clear sequence of steps at projecting, analysis, and documenting of information system. It involves 6 main stages: analysis of existing system or estimation of practicability, requirements definition, determination of technical requirements and equipment cost, development of logical data model, projecting of logical requirements and specification them, physical projecting. Each of them is also divided into several steps defining the tasks that should be fulfilled at a given stage. The most important SSADM elements are flows modeling with help of DFD, data logic modeling with help of LDS (Logical Data Structure) and description of entities behavior. Applying of SSADM is easy with ConceptDraw DIAGRAM diagramming and vector drawing software and Data Flow Diagram solution.Program Evaluation and Review Technique (PERT) with ConceptDraw DIAGRAM
Program Evaluation and Review Technique (abbr. PERT) is a method developed by Ministry of Defense of the USA in 1958 for the project of creation the missile system Polaris. PERT diagram is one of the tools for project management that lets greatly simplify the planning and scheduling of large and complex projects. PERT diagram provides evaluation of project run-time and labor forces, it helps to analyze the time necessary for execution each of project tasks and the whole project, and to calculate the project critical path. PERT chart depicts the set of tasks connected each other in order of their execution and is constructed according to one of definite rules - AOA (activity on arrow) or AON (activity on node). It doesn't give you ready concrete decisions, but helps to find them. Design easy the PERT diagrams in ConceptDraw DIAGRAM software enhanced with Seven Management and Planning Tools solution from Management area of ConceptDraw Solution Park. You have a possibility to build the PERT chart of any type, but AON variant is easier for building and perception.Vertical Cross Functional Flowchart
ConceptDraw DIAGRAM is a powerful tool that helps you create professional looking cross-functional flowcharts with the well-designed objects. ConceptDraw DIAGRAM - Drawing Software for Vertical Cross Functional Flowchart. ConceptDraw allows you to focus on work, not the drawing process. ConceptDraw Arrows10 Technology allows to draw connectors with smart behavior that gives flexibility to you during work process.Work Flow Chart
What is a Work Flow Chart? It is a chart which visually displays the step-by-step transferring of data, documents and tasks during the work. ConceptDraw DIAGRAM extended with Workflow Diagrams solution from the Business Processes area of ConceptDraw Solution Park is the best software for drawing the Work Flow Chart of any complexity.Network Topology Graphical Examples
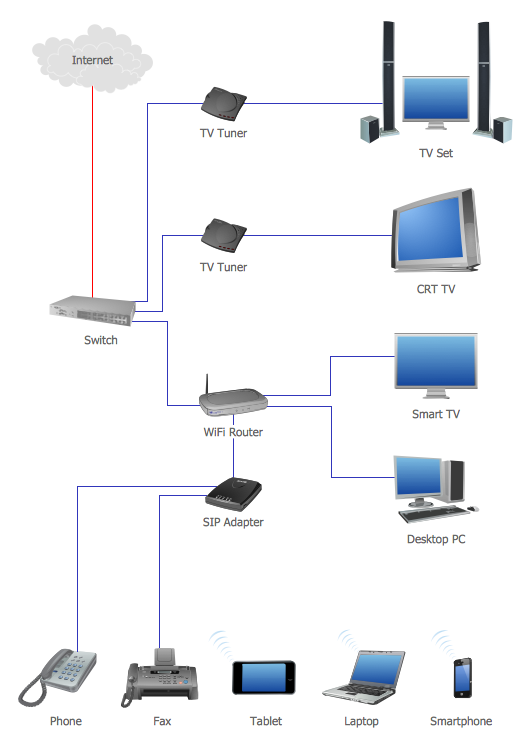
Computer and Networks solution provides examples, templates and vector stencils library with symbols of local area network (LAN) and wireless LAN (WLAN) equipment. This example of computer network topology diagram shows home WLAN equipment and their connection to the Internet.Flow Diagrams
Flow diagrams is a diagram used for structuring complex system and visually representing a flow and interactions of elements in a system. ConceptDraw DIAGRAM diagramming and vector drawing software enhanced with Flowcharts Solution from the "Diagrams" Area of ConceptDraw Solution Park is perfect for easy drawing professional looking Flow Diagrams. For drawing Flow Diagrams the Flowcharts Solution provides: 2 libraries with commonly used predesigned vector objects - Flowchart library and Flowcharts Rapid Draw library; collection of Flow Diagrams samples; Basic Flowchart template.ConceptDraw Arrows10 Technology
When using a shapes′ center connection the connection becomes dynamic, the connector will trace the contour of the object, when moving the object inside your diagram. Using any other connection point provides a static connection, when you move connected objects the connector stays attached to the same point.Critical Path Method in ConceptDraw PROJECT
The Critical Path Method (CPM) is an algorithm for scheduling a set of project activities. It is an important tool for effective project management. ConceptDraw PROJECT implements this method to provide the user with a wide set of project management tools.What Is a Line Chart
What Is a Line Chart? A line chart is a basic type of chart represented by a series of data points connected with a straight line. Explaining the meaning of “What is a line chart?” is convenient to use illustrations with professional looking line charts designed in ConceptDraw DIAGRAM diagramming and vector drawing software extended with Line Graphs solution from the Graphs and Charts area.UML Diagram Visio
This sample shows the UML Class Diagram that was created in ConceptDraw DIAGRAM on the Mac and then was opened for editing in MS Visio. Using the 13 libraries of the Rapid UML Solution for ConceptDraw DIAGRAM you can create your own visual vector UML diagrams quick and easy.Flowchart Definition
Flowchart definition - A Flowchart is a diagram that graphically represents the structure of the system, the flow of steps in a process, algorithm, or the sequence of steps and decisions for execution a process or solution a problem. For depiction the steps there are used specific shapes and graphic symbols which are linked by lines and directional arrows. The main standard shapes are rectangle or box, rounded box, diamond, circle. A Flowchart is a convenient way to observe the follow the process from beginning to end, it lets improve the work of process, highlight the key elements and detach not essential or even excessive steps. The Flowcharts can represent different levels of detail: High-Level Flowchart, Detailed Flowchart, and Deployment or Matrix Flowchart. They are incredibly useful for programmers when developing the programs of any complexity and on any high level language. Create your own Flowcharts using the ConceptDraw DIAGRAM diagramming and vector drawing software and powerful tools of Flowcharts solution from "Diagrams" area.Interface Design
Website wireframes are convenient and widely used by developers, visual designers, business analysts, and many other people related with projection, development and promotion websites. Usually website wireframes look lacking of brilliance, but they effectively reflect website functionality, content and visually represent its skeletal framework. ConceptDraw DIAGRAM software offers a unique Website Wireframe solution from the Software Development area with all needed tools for fast and easy drawing professional looking website wireframe with attractive interface design.How to Create Gantt Chart
To begin managing a new project, you will need to define the individual Tasks that must be completed to deliver it. The default view for a new project in ConceptDraw PROJECT is the Gantt Chart.Hotel Plan. Hotel Plan Examples
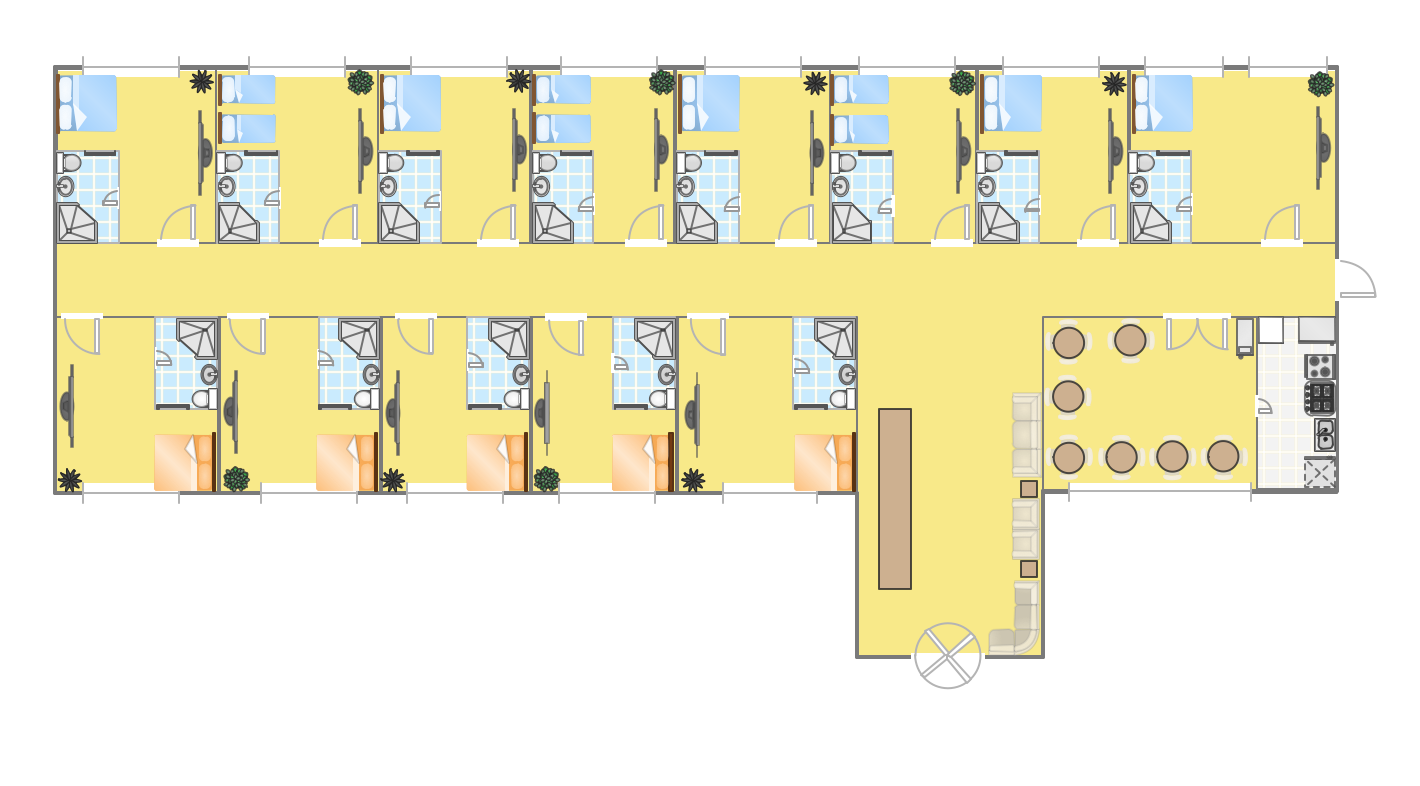
The hotels vary hard enough by the rating, service level, cost, size, location, style, and many other parameters. Before beginning the construction of new hotel, inn or a hotel complex, you first need to create a detailed overall hotel plan, the location plans of rooms, lobby, restaurant and other common premises and service rooms. The projects of mini-hotels must use the space particularly rational, at the same time the large hotels can afford spacious halls, banquet halls and even terraces. ConceptDraw DIAGRAM diagramming and vector drawing software enhanced with Basic Floor Plans and Floor Plans solutions from the Building Plans area of ConceptDraw Solution Park offer the set of predesigned vector stencils libraries with large selection of symbols of interior design elements, furniture and equipment for easy drawing the Hotel plans, Hotel floor plans, Hotel design plans, Space layouts, Layouts of furniture and equipment, etc. The offered templates and Floor plan samples will be also useful for you.Wireframe Tools
A wireframe is a scheme of a future web page. Wireframe illustrates the web page structure, location and size of the main elements, as well as their interaction with the user. With such scheme designer defines the functionality of the page, not its appearance.Affinity Diagram
The affinity diagram is a business tool used to organize ideas and data. It is one of the Seven Management and Planning Tools. But how design the Affinity Diagram quick and easy? ConceptDraw DIAGRAM diagramming and vector drawing software offers the Seven Management and Planning Tools Solution from the Management Area.Campus Area Networks (CAN). Computer and Network Examples
Campus Area Network (CAN) is a computer network which provides wireless access to the Internet or LAN for the users located in two or more buildings on the limited geographical area, or in the open space surrounding these buildings. Campus Area Network is usually set in campus of a university or college, but the same kind of planning and design can be applied for other purposes, for enterprises, office buildings, military bases, industrial complexes, public places like supermarkets, entertainment centers, etc. Another form of temporary CAN can exist during some special events such as rallies, music festivals. The elementary Campus Area Network can also arise spontaneously, due to the distance of spread the radio signals from the access points that are not limited by buildings walls. It is also sensible to have additional access points for the larger and more complex CANs, located at specially places chosen for serving clients. Design easy diagrams and schemes for the Campus Area Networks with Computer Network Diagrams solution for ConceptDraw DIAGRAM.
Software and Database Design with ConceptDraw DIAGRAM
Unified Modeling Language (abbr. UML) is a modeling language used by software developers and software engineers for developing diagrams, expressive modeling, visualization, construction, specification, and documentation an information about software-intensive systems. There are used many types of UML diagrams, joined in main groups, each of them has its own functional abilities and applications: Behaviour diagrams illustrate the functionality of software systems, Structuring diagrams depict a structure of objects at the systems, Interaction diagrams show the flow of control and data among the things in a modeling system. UML has a lot of practical applications in varied areas, among them software development, hardware design, banking and financial services, telecommunication, science, research, enterprise information system, distributed Web-based services, user interfaces for web applications, medical electronics, patient healthcare systems, etc. ConceptDraw DIAGRAM extended with Rapid UML solution is a perfect tool for UML diagramming.Stakeholder Onion Diagrams
The Stakeholder Onion Diagram is a popular and widely used way to view the relationships of stakeholders to a project goal. The Onion Diagram focuses on the project goal, most of other diagram styles focus on the project, stakeholders, and timeline. This difference favorably distinguishes and separates the Onion Diagram from other types of diagrams. Design fast and easy Stakeholder Onion Diagrams of any complexity in ConceptDraw DIAGRAM diagramming and vector drawing software using the powerful tools of Stakeholder Onion Diagrams Solution from the Management Area of ConceptDraw Solution Park.ERD Symbols and Meanings
Entity Relationship Diagram (ERD) is a popular software engineering tool for database modeling and illustration the logical structure of databases, which uses one of two notations - Chen's or Crow’s Foot. Crow's foot notation is effective when used in software engineering, information engineering, structured systems analysis and design. Each of these notations applies its own set of ERD symbols. Crow's foot diagrams use boxes to represent entities and lines between these boxes to show relationships. Varied shapes at the ends of lines depict the cardinality of a given relationship. Chen's ERD notation is more detailed way to represent entities and relationships. ConceptDraw DIAGRAM application enhanced with all-inclusive Entity-Relationship Diagram (ERD) solution allows design professional ER diagrams with Chen's or Crow’s Foot notation on your choice. It contains the full set of ready-to-use standardized ERD symbols and meanings helpful for quickly drawing, collection of predesigned ERD samples, examples and templates. ConceptDraw Pro is a great alternative to Visio for Mac users as it offers more features and can easily handle the most demanding professional needs.
- Advantages And Disadvantages Of Ssadm
- Ssadm Advantages And Disadvantages
- Structured Systems Analysis and Design Method. SSADM with ...
- Structured Systems Analysis and Design Method ( SSADM ) with ...
- Advantages And Disadvantage Of Ssadm
- Structured Systems Analysis and Design Method ( SSADM ) with ...
- Structured Systems Analysis and Design Method. SSADM with ...
- JSD - Jackson system development | Advantages Of Jsd
- Structured Systems Analysis and Design Method ( SSADM ) with ...
- Advantages And Disadvantages Of Data Flow Diagram
- Topology Advantages And Disadvantages
- JSD - Jackson system development | What Are Advantages Of ...
- Structured Systems Analysis and Design Method. SSADM with ...
- JSD - Jackson system development | Advantages Of Michael ...
- Advantages And Limitations Of Fault Tree Analysis
- Advantage Of Jackson System Development
- Structured Systems Analysis and Design Method. SSADM with ...
- Cisco Network Templates | Microsoft Visio Pfd Advantages And ...
- Advantages And Disadvantages Of Fault Analysis
- Advantages And Disadvantages Of Fault Tree Analysis


