Structured Systems Analysis and Design Method (SSADM) with ConceptDraw PRO
Structured Systems Analysis and Design Method (abbr. SSADM) is a method developed in Great Britain and accepted in 1993 as a national standard for information systems development and analysis. SSADM is based on Data Flow Diagrams and is characterized with presence of clear sequence of steps at projecting, analysis, and documenting of information system. It involves 6 main stages: analysis of existing system or estimation of practicability, requirements definition, determination of technical requirements and equipment cost, development of logical data model, projecting of logical requirements and specification them, physical projecting. Each of them is also divided into several steps defining the tasks that should be fulfilled at a given stage. The most important SSADM elements are flows modeling with help of DFD, data logic modeling with help of LDS (Logical Data Structure) and description of entities behavior. Applying of SSADM is easy with ConceptDraw PRO diagramming and vector drawing software and Data Flow Diagram solution.Technical Flow Chart
Flow chart is a diagrammatic representation of an algorithm and essential part of planning the system. Flow charts are widely used in technical analysis and programming for easy writing programs and explaining them to others. So, one of the most popular type of flow charts is Technical Flow Chart. Technical Flow Chart can be drawn by pencil on the paper, but it will be easier to use for designing a special software. ConceptDraw PRO diagramming and vector drawing software extended with Flowcharts Solution from the "Diagrams" Area of ConceptDraw Solution Park will be useful for this goal.Process Flowchart
The main reason of using Process Flowchart or PFD is to show relations between major parts of the system. Process Flowcharts are used in process engineering and chemical industry where there is a requirement of depicting relationships between major components only and not include minor parts. Process Flowcharts for single unit or multiple units differ in their structure and implementation. ConceptDraw PRO is Professional business process mapping software for making Process flowcharts, Process flow diagram, Workflow diagram, flowcharts and technical illustrations for business documents and also comprehensive visio for mac application. Easier define and document basic work and data flows, financial, production and quality management processes to increase efficiency of your business with ConcepDraw PRO. Business process mapping software with Flowchart Maker ConceptDraw PRO includes extensive drawing tools, rich examples and templates, process flowchart symbols and shape libraries, smart connectors that allow you create the flowcharts of complex processes, process flow diagrams, procedures and information exchange. Process Flowchart Solution is project management workflow tools which is part ConceptDraw Project marketing project management software. Drawing charts, diagrams, and network layouts has long been the monopoly of Microsoft Visio, making Mac users to struggle when needing such visio alternative like visio for mac, it requires only to view features, make a minor edit to, or print a diagram or chart. Thankfully to MS Visio alternative like ConceptDraw PRO software, this is cross-platform charting and business process management tool, now visio alternative for making sort of visio diagram is not a problem anymore however many people still name it business process visio tools.
Types of Flowcharts
A Flowchart is a graphical representation of process, algorithm, workflow or step-by-step solution of the problem. It shows the steps as boxes of various kinds and connects them by arrows in a defined order depicting a flow. There are twelve main Flowchart types: Basic Flowchart, Business Process Modeling Diagram (BPMN), Cross Functional Flowchart, Data Flow Diagram (DFD), IDEF (Integrated DEFinition) Flowchart, Event-driven Process Chain (EPC) Diagram, Influence Diagram (ID), Swimlane Flowchart, Process Flow Diagram (PFD), Specification and Description Language (SDL) Diagram, Value Stream Mapping, Workflow Diagram. Using the Flowcharts solution from the Diagrams area of ConceptDraw Solution Park you can easy and quickly design a Flowchart of any of these types. This solution offers a lot of special predesigned vector symbols for each of these widely used notations. They will make the drawing process of Flowcharts much easier than ever. Pay also attention for the included collection of ready Flowchart examples, samples and quick-start templates. This is business process improvement tools. If you are looking for MS Visio for your Mac, then you are out of luck, because it hasn't been released yet. However, you can use Visio alternatives that can successfully replace its functions. ConceptDraw PRO is an alternative to MS Visio for Mac that provides powerful features and intuitive user interface for the same.
JSD - Jackson system development
Jackson System Development (JSD) is a linear method of system development created by Michael A. Jackson and John Cameron in the 1980s. It comprises the whole software life cycle directly or providing a framework for more specialized techniques. When implementing the Jackson System Development method and designing JSD diagrams, you can succesfully use the powerful and helpful tools of ConceptDraw PRO software extended with Entity-Relationship Diagram (ERD) solution from the Software Development area of ConceptDraw Solution Park.Detail Specifications Exchanging Mind Maps with Evernote
ConceptDraw Note Exchange Solution permits users to develop and organize notes and tasks in ConceptDraw MINDMAP. Your work can be accessed later, just with one click, regardless of preferred platform.Flow Map
A Flow Map is a type of thinking maps which help easy organize and understand information. It consists of the set of boxes and arrows, and visually displays a sequence of events. ConceptDraw PRO diagramming and vector drawing software extended with Flowcharts Solution from the "Diagrams" Area of ConceptDraw Solution Park allows you to draw in a few minutes the Flow Map of any degree of complexity.Total Quality Management with ConceptDraw
Total Quality Management (TQM) system is the management method where the confidence in quality of all organization processes is placed foremost. The given method is widely used in production, in educational system, in government organizations and so on.Flowchart design. Flowchart symbols, shapes, stencils and icons
A flowchart is a type of diagram which represents an algorithm, process or workflow, displays the steps as boxes of various kinds and depicts their order by connecting them with arrows. Any business graphic document will be more colorful and understandable if will use professional-looking and visual diagrams and flowcharts. Flowchart design gives versatile presenting and explaining of the process. ConceptDraw PRO flowchart software enhanced with Flowcharts solution helps effectively make Flowchart Design. Use of predesigned flowchart symbols and bright color palette offers a fresh view and favorably distinguishes the flowcharts designed in ConceptDraw PRO from the black and white flowcharts on a paper. Preferably to use no more than three or four colors and apply identical for the same shape types. The best flowchart design can be achieved by starting with Flowchart template, or any of suitable ready examples or samples offered in ConceptDraw STORE, open one of them and enter the proper text into each Flowchart shape. Each symbol of the flowchart has a definition that can't be changed. This means that all flowcharts shapes can be grouped in according to their meaning. Users with ConceptDraw PRO flowchart software can style groups of symbols with close definitions by color sets chosen from complementary palette. Almost all workflows can be depicted as a flowchart. Colored diagrams are more light for perception of the certain information, this is part of flowchart design. Bright colors need to be used in the key points of Decision symbols, to focus attention on their importance for whole process flow.
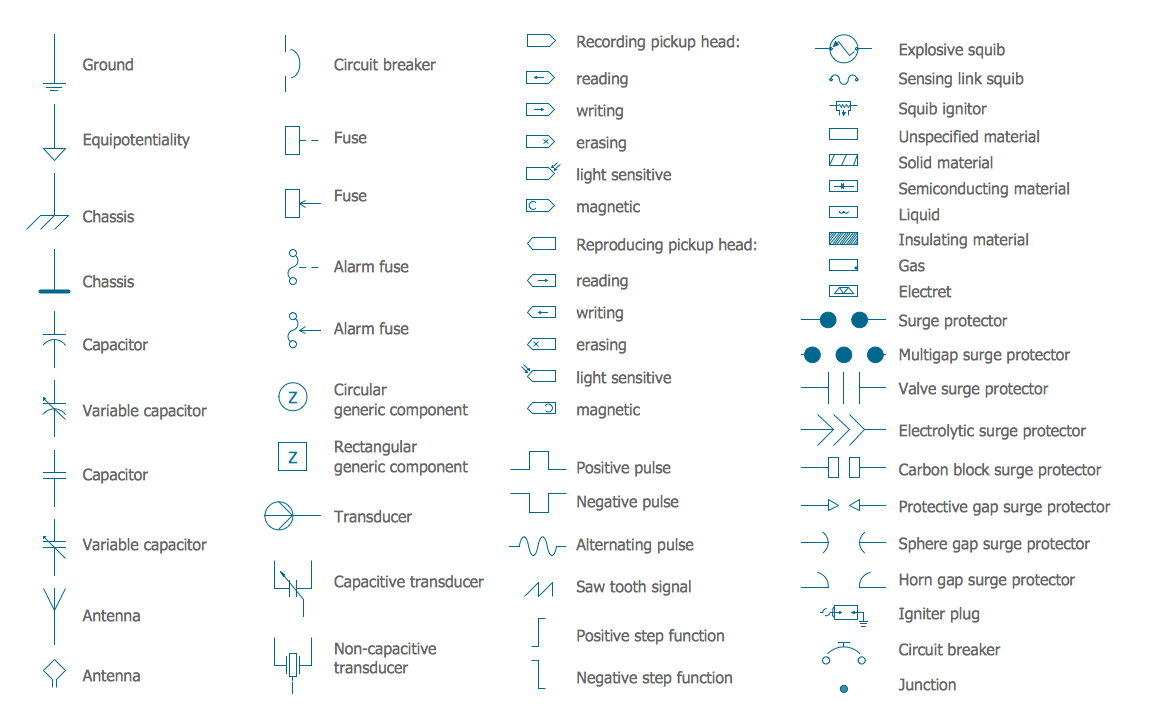
Electrical Symbols — Electrical Circuits
A circuit diagram or wiring diagram uses symbols to represent parts of a circuit. Electrical and electronic circuits can be complicated. Making a drawing of the connections to all the component parts in the circuit's load makes it easier to understand how circuit components are connected. Drawings for electronic circuits are called "circuit diagrams". Drawings for electrical circuits are called "wiring diagrams". 26 libraries of the Electrical Engineering Solution of ConceptDraw PRO make your electrical diagramming simple, efficient, and effective. You can simply and quickly drop the ready-to-use objects from libraries into your document to create the electrical diagram.Types of Flowchart - Overview
When designing a process or an instruction in clear and understandable way, you should consider creating a flowchart. You can avoid spending a lot of time understanding complex concepts as they get clear with different diagrams. The flowcharts are very popular diagram type, they are useful at different fields from the description business processes to the presentation of cooking recipes. Basic Flowchart, Business Process Modeling Diagram, Process Flowchart, Cross Functional Flowchart, Procedure Flowchart, Data Flow Diagram, IDEF Flowchart, SDL Diagram, Workflow Diagram, Document Flowchart, Program Flowchart, Value Stream Map, System Flowchart, Highlight Flowchart, Sales Flowchart are the main types flowchart. The ConceptDraw PRO is one of the professional applications which has great advantages and using which you can create different types of Flowcharts easy and fast. Try to draw an illustrative and comprehensible diagram in ConceptDraw PRO describing the processes instead of writing complex long text and make sure how it is convenient. Visio is expensive, and if you use it in a team environment, these costs are compounded. ConceptDraw PRO is an affordable alternative to Visio and luckily, it comes with a team plan. ConceptDraw PRO can import and export Visio files, so Mac users can collaborate with PC users stuck on Microsoft's software.
Pyramid Diagram
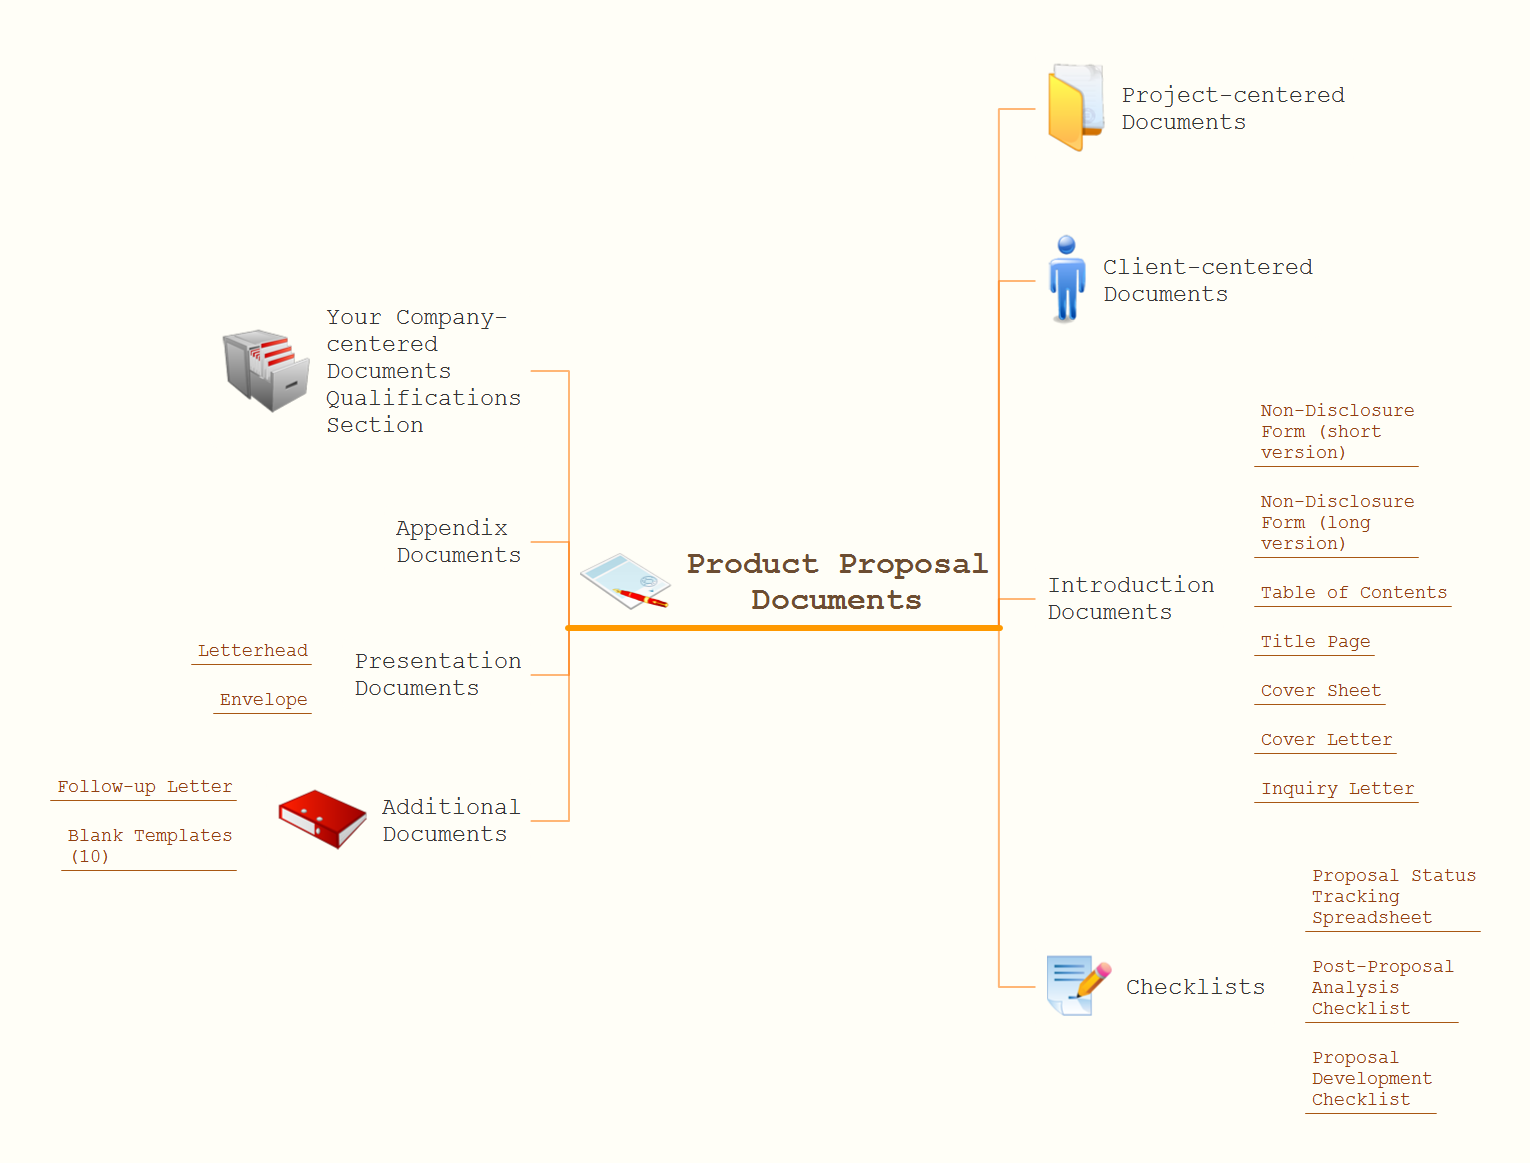
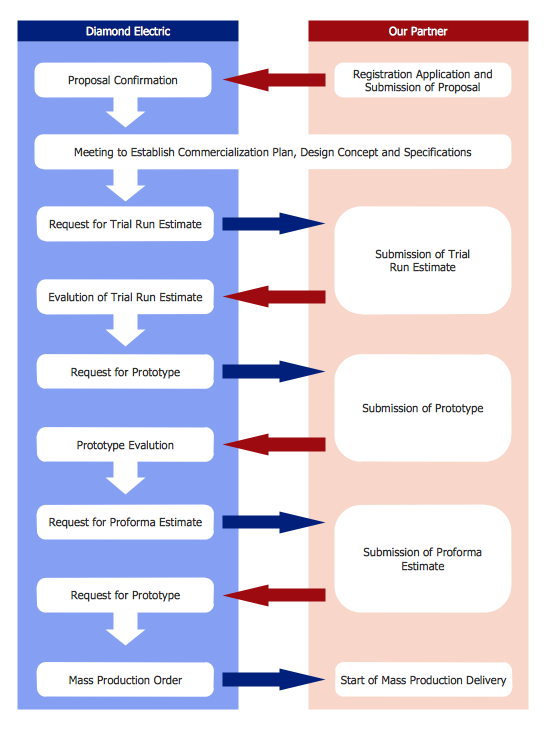
A five level pyramid model of different types of Information Systems based on the information processing requirement of different levels in the organization. five level pyramid example is included in the Pyramid Diagrams solution from Marketing area of ConceptDraw Solution Park.Product Proposal Template
This template was created in ConceptDraw PRO diagramming and vector drawing software using the Block Diagrams Solution from the “Diagrams” area of ConceptDraw Solution Park. This template shows the Product Proposal Diagram on that is displayed the sequence of the product planning steps. This diagram is convenient, visual and clear.Software development with ConceptDraw PRO
Modern software development requires creation of large amount of graphic documentation, these are the diagrams describing the work of applications in various notations and cuts, also GUI design and documentation on project management. ConceptDraw PRO technical and business graphics application possesses powerful tools for software development and designing technical documentation for object-oriented projects. Solutions included to the Software Development area of ConceptDraw Solution Park provide the specialists with possibility easily and quickly create graphic documentation. They deliver effective help in drawing thanks to the included package of templates, samples, examples, and libraries with numerous ready-to-use vector objects that allow easily design class hierarchies, object hierarchies, visual object-oriented designs, flowcharts, GUI designs, database designs, visualize the data with use of the most popular notations, including the UML and Booch notations, easy manage the development projects, automate projection and development.SWOT Analysis
Most of the data needed for market analysis (demand, prices, volume of sales, etc.) are undefined, and in future are possible their changes as in the worst and the best side. SWOT analysis is effective method for prediction these processes and decision making for organizations that function in a competitive environment. It allows you to see the whole situation, to identify the strengths and weaknesses of organization (advantages and disadvantages), as well as opportunities and threats of external environment. The results of SWOT analysis are the basis for optimization the business processes, for development by the leading specialists in organization of interrelated complex of strategies and competitive activities. ConceptDraw PRO software enhanced with SWOT and TOWS Matrix Diagrams Solution will effectively help you in strategic planning for your company, department, project, in development marketing campaign, in identification of four categories of factors of internal and external environment of organization, and construction professional-looking SWOT and TOWS matrices.- Structured Systems Analysis and Design Method ( SSADM ) with ...
- Structured Systems Analysis and Design Method ( SSADM ) with ...
- Structured Systems Analysis and Design Method ( SSADM ) with ...
- Structured Systems Analysis and Design Method ( SSADM ) with ...
- Structured Systems Analysis and Design Method ( SSADM ) with ...
- Types of Flowcharts | Structured Systems Analysis and Design ...
- Structured Systems Analysis and Design Method ( SSADM ) with ...
- Process Flowchart | Star Network Topology | Structured Systems ...
- Structured Systems Analysis and Design Method ( SSADM ) with ...
- JSD - Jackson system development | Advantages Of Jackson Systems
- Advantages Of Flowchart In Structure Analysis
- Gane Sarson Diagram | Structured Systems Analysis and Design ...
- Structured Systems Analysis and Design Method ( SSADM ) with ...
- Process Flowchart | Types of Flowcharts | Structured Systems ...
- Stakeholder Onion Diagrams | Fault Tree Analysis Advantages And ...
- Structured Systems Analysis and Design Method ( SSADM ) with ...
- What Is Advantage Of State Diagram Draw The State Diagram For
- Flowchart System Analysis Design
- Campus Area Network Advantages And Disadvantages Ppt
- Structured Systems Analysis and Design Method ( SSADM ) with ...


