Advertising - Design Elements
Business and Finance solution from Illustration area of ConceptDraw Solution Park - use it to quick draw illustrations, diagrams and infographics for your advertising and marketing documents, presentations and websites. The vector clipart library Advertising includes 8 concept images.Process Flowchart
The main reason of using Process Flowchart or PFD is to show relations between major parts of the system. Process Flowcharts are used in process engineering and chemical industry where there is a requirement of depicting relationships between major components only and not include minor parts. Process Flowcharts for single unit or multiple units differ in their structure and implementation. ConceptDraw PRO is Professional business process mapping software for making Process flowcharts, Process flow diagram, Workflow diagram, flowcharts and technical illustrations for business documents and also comprehensive visio for mac application. Easier define and document basic work and data flows, financial, production and quality management processes to increase efficiency of your business with ConcepDraw PRO. Business process mapping software with Flowchart Maker ConceptDraw PRO includes extensive drawing tools, rich examples and templates, process flowchart symbols and shape libraries, smart connectors that allow you create the flowcharts of complex processes, process flow diagrams, procedures and information exchange. Process Flowchart Solution is project management workflow tools which is part ConceptDraw Project marketing project management software. Drawing charts, diagrams, and network layouts has long been the monopoly of Microsoft Visio, making Mac users to struggle when needing such visio alternative like visio for mac, it requires only to view features, make a minor edit to, or print a diagram or chart. Thankfully to MS Visio alternative like ConceptDraw PRO software, this is cross-platform charting and business process management tool, now visio alternative for making sort of visio diagram is not a problem anymore however many people still name it business process visio tools.
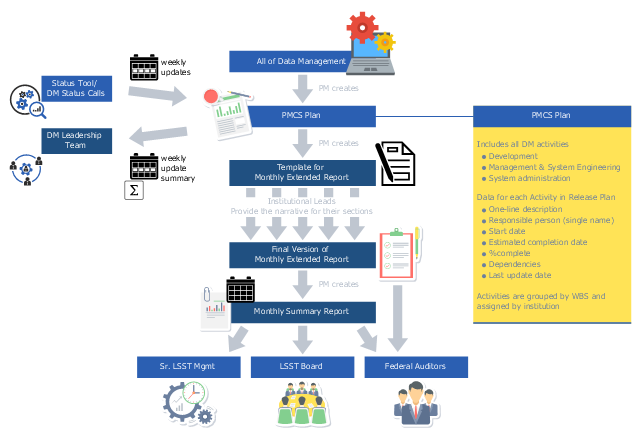
This business infographic sample depicts the project data management reporting system processes. It was designed on the base of the diagram "Weekly Updates and Monthly Reports" from the wiki of the Large Synoptic Survey Telescope (LSST) project.
" The DM project uses the following process for monthly reporting:
1. ... the DM Project Manager maintains data challenge release and management/ system engineering plans in the LSST Project Management Control System (PMCS). Each activity in the plan includes the name of the activity, expected start and end dates, and assignees (with primary/ lead person listed first).
2. The LSST Project provides a web-based tool for weekly status reporting against the plan. The status collected included % complete, actual and expected start and finish dates, and comments."
[dev.lsstcorp.org/ trac/ wiki/ PlanningReportingProcess#DataManagementReportingProcess]
"Data management comprises all the disciplines related to managing data as a valuable resource." [Data management. Wikipedia]
The business infographic example "Data management reporting process" was designed using ConceptDraw PRO diagramming and vector drawing software extended with the Business and Finance solution from Illustration area of ConceptDraw Solution Park.
BPMN 2.0
ConceptDraw PRO diagramming and vector drawing software offers the Business Process Diagram Solution from the Business Processes Area of ConceptDraw Solution Park with powerful tools to help you easy represent the business processes and create the business process diagrams based on BPMN 2.0 standard.Pyramid Diagram
The Time-Money-Quality Triangle illustrates an advertising truism, that you can't have all three.Stakeholder Management System
Stakeholder management is a critical component to the successful delivery of any project, programme or activity. ConceptDraw PRO is a powerful diagramming and vector drawing software. Now, thanks to the Stakeholder Onion Diagrams Solution included to the Management Area of ConceptDraw Solution Park, ConceptDraw PRO became also unique stakeholder management system design software.UML Use Case Diagram Example Social Networking Sites Project
UML Diagrams Social Networking Sites Project. This sample was created in ConceptDraw PRO diagramming and vector drawing software using the UML Use Case Diagram library of the Rapid UML Solution from the Software Development area of ConceptDraw Solution Park. This sample shows the Facebook Socio-health system and is used at the projection and creating of the social networking sites.SWOT Sample in Computers
SWOT analysis is an effective method of making the plan for evaluation the Strengths, Weaknesses, Opportunities, and Threats that are involved in a project. It is actively applied in business sphere and helps define the objective of the project. It lets detect and represent the external and internal causes for the accomplishing the project goals and business purposes, and also plays important role in formation successful and perspective business. ConceptDraw PRO is a perfect diagramming software which nicely suits for SWOT analysis and representation its results in the form of SWOT diagrams of different complexity and design, thanks to the included SWOT and TOWS Matrix Diagrams solution from Management area of ConceptDraw Solution Park. This solution contains a lot of specially designed SWOT templates, SWOT matrix samples (SWOT analysis sample, SWOT sample in computers, SWOT matrix for business sphere, SWOT matrix educational, and many others), and also ready SWOT matrix objects that allow users create their own SWOT diagrams in minutes.Business and Finance Illustrations
Choose the business illustration design you love best, and sign our design your own style with Business and Finance Illustrations library from ConceptDraw PRO. The Business and Finance solution contains 12 vector clipart libraries: Advertising, Business, Business people clipart, Business people figures, Currency, Mail and post, Management, Marketing, Money, Office, Project management, TimeDiagramming Software for Design UML Communication Diagrams
UML Communication Diagram depicts the interactions between objects or parts in terms of sequenced messages and describes both the static structure and dynamic behavior of a system.
Business Productivity - Management
The widespread of Mind Maps in the field of management is justified and very convenient. The managers and leaders work with large amount of information and data, and need the useful tools for its structuring and systemizing. They prefer to use the powerful Mind Mapping software that gives them a lot of benefits. ConceptDraw MINDMAP is professional software for management, business planning, strategic planning, business productivity and development. It provides the powerful tools which help managers to be effective and improve their productivity, supports them in easy visual documenting and communication the management information. Use ConceptDraw MINDMAP to build the Management Diagrams (Matrices, Organizational Charts, Deployment Charts, Timelines, Cause & Effect (Fishbone) Diagrams) and key management Mind Maps (SWOT analysis, problem solving, decision making, business planning, scheduling, thinking ideas, company organizing, preparing and holding the meetings and presentations) quickly and easily.Systems Engineering
Systems engineering is an interdisciplinary field of engineering that focuses on how to design and manage complex engineering systems over their life cycles. ConceptDraw PRO supplied with SysML Solution from the Software Development Area of ConceptDraw Solution Park is a powerful and effective systems engineering software.
Business and Finance
Use Business and Finance solution to make professional-looking documents, presentations and websites, business, finance, advertising, and project management illustrations, or any designs that requires clipart of currency, office, business, advertising, management, marketing, people, time, post, contacts, collaboration, etc.
UML Class Diagram Example - Apartment Plan
UML Apartment Plan. This sample was created in ConceptDraw PRO diagramming and vector drawing software using the UML Class Diagram library of the Rapid UML Solution from the Software Development area of ConceptDraw Solution Park. This sample show the detailed plan of the apartment and is used by building companies, design apartments, real estate agencies, at the buying / selling of the realty.Example of DFD for Online Store (Data Flow Diagram) DFD Example
Data Flow Diagram (DFD) is a methodology of graphical structural analysis and information systems design, which describes the sources external in respect to the system, recipients of data, logical functions, data flows and data stores that are accessed. DFDs allow to identify relationships between various system's components and are effectively used in business analysis and information systems analysis. They are useful for system’s high-level details modeling, to show how the input data are transformed to output results via the sequence of functional transformations. For description of DFD diagrams are uses two notations — Yourdon and Gane-Sarson, which differ in syntax. Online Store DFD example illustrates the Data Flow Diagram for online store, the interactions between Customers, Visitors, Sellers, depicts User databases and the flows of Website Information. ConceptDraw PRO enhanced with Data Flow Diagrams solution lets you to draw clear and simple example of DFD for Online Store using special libraries of predesigned DFD symbols.
- Advertisement System Project Activity Diagram Download
- Activity Diagram For Online Advertisement Management System
- Activity Diagram For Gym Management System
- Use Case Diagram For Advertisement Management System
- Uml Diagrams For Online Post Office Account Management System
- Activity Diagram For News Paper Agency System
- Activity Diagram For Secondary School Management System
- Advertisement Management System Dfd
- Activity Diagram For Online Advertising
- ATM UML Diagrams | Business and Finance | Activity Diagram For ...
- Financial Trade UML Use Case Diagram Example | SysML activity ...
- Activity Diagram Of Gym Management System
- Foreign Exchange Management System Uml Diagram
- Activity Diagram For Online Resort Management System
- Audit Management System Usecase
- Marketing Activities Diagram
- SysML activity diagram | Process Flowchart | Financial Trade UML ...
- Use Case Diagram For Financial Management System
- Advertising Block Diagram
- Activity Diagrams For Water Management