 Marketing Diagrams
Marketing Diagrams solution extends ConceptDraw DIAGRAM diagramming software with abundance of samples, templates and vector design elements intended for easy graphical visualization and drawing different types of Marketing diagrams and graphs, including Branding Strategies Diagram, Five Forces Model Diagram, Decision Tree Diagram, Puzzle Diagram, Step Diagram, Process Chart, Strategy Map, Funnel Diagram, Value Chain Diagram, Ladder of Customer Loyalty Diagram, Leaky Bucket Diagram, Promotional Mix Diagram, Service-Goods Continuum Diagram, Six Markets Model Diagram, Sources of Customer Satisfaction Diagram, etc. Analyze effectively the marketing activity of your company and apply the optimal marketing methods with ConceptDraw DIAGRAM software.
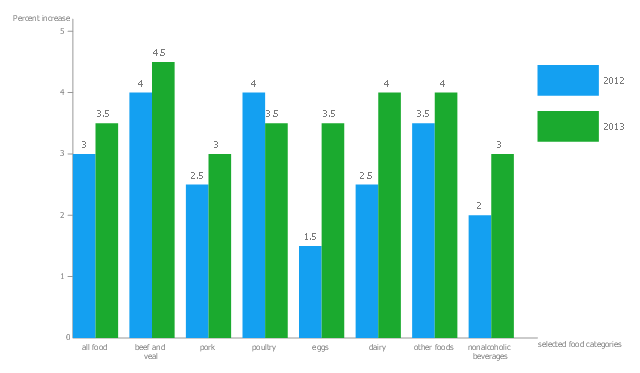
This two series column chart sample shows the forecasted changes in price indices for selected food categories in 2012 and 2013. It was designed on the base of the bar graph on the webpage "Price impacts of 2012 drought expected to be larger in 2013 for most foods" from the website of the United States Department of Agriculture Economic Research Service. [ers.usda.gov/ data-products/ chart-gallery/ detail.aspx?chartId=29456&ref=collection#.Ue5MMaxad5I]
"A price index (plural: “price indices” or “price indexes”) is a normalized average (typically a weighted average) of price relatives for a given class of goods or services in a given region, during a given interval of time. It is a statistic designed to help to compare how these price relatives, taken as a whole, differ between time periods or geographical locations.
Price indexes have several potential uses. For particularly broad indices, the index can be said to measure the economy's general price level or a cost of living. More narrow price indices can help producers with business plans and pricing. Sometimes, they can be useful in helping to guide investment." [Price index. Wikipedia]
The double bar chart example "Changes in price indices" was created using the ConceptDraw PRO diagramming and vector drawing software extended with the Basic Bar Graphs solution from the Graphs and Charts area of ConceptDraw Solution Park.
Double bar graph
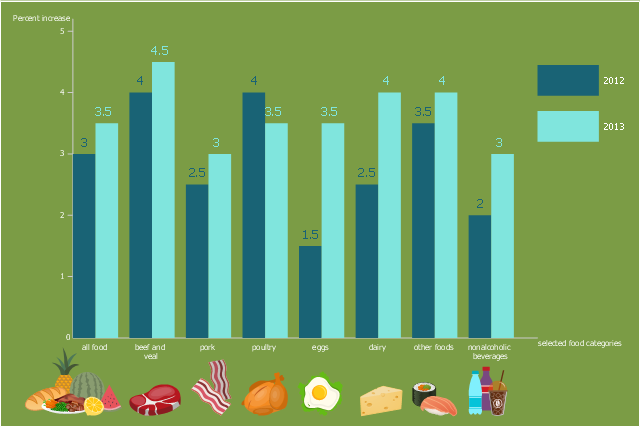
This double bar chart sample shows the forecasted impacts of 2012 drought expected to be larger in 2013 for most foods. It was designed in the base of the graph from the webpage "Price impacts of 2012 drought expected to be larger in 2013 for most foods" on the website of the United States Department of Agriculture Economic Research Service. [ers.usda.gov/ data-products/ chart-gallery/ detail.aspx?chartId=29456&ref=collection#.Ue5MMaxad5I]
"A price index (plural: “price indices” or “price indexes”) is a normalized average (typically a weighted average) of price relatives for a given class of goods or services in a given region, during a given interval of time. It is a statistic designed to help to compare how these price relatives, taken as a whole, differ between time periods or geographical locations.
Price indexes have several potential uses. For particularly broad indices, the index can be said to measure the economy's general price level or a cost of living. More narrow price indices can help producers with business plans and pricing. Sometimes, they can be useful in helping to guide investment." [Price index. Wikipedia]
The column chart example "Changes in price indices" was created using the ConceptDraw PRO diagramming and vector drawing software extended with the Bar Graphs solution from the Graphs and Charts area of ConceptDraw Solution Park.
Double bar graph
Design Pictorial Infographics. Design Infographics

Bar Diagrams for Problem Solving. Create economics and financial bar charts with Bar Graphs Solution

Information Graphics

Sample Pictorial Chart. Sample Infographics

 Flowcharts
The Flowcharts solution for ConceptDraw DIAGRAM is a comprehensive set of examples and samples in several varied color themes for professionals that need to represent graphically a process. Solution value is added by the basic flow chart template and shapes' libraries of flowchart notation. ConceptDraw DIAGRAM flow chart creator lets one depict the processes of any complexity and length, as well as design the Flowchart either vertically or horizontally.
 Food Court
Use the Food Court solution to create food art. Pictures of food can be designed using libraries of food images, fruit art and pictures of vegetables.
Bar Diagrams for Problem Solving. Create manufacturing and economics bar charts with Bar Graphs Solution

Infographic Software

Information Graphic

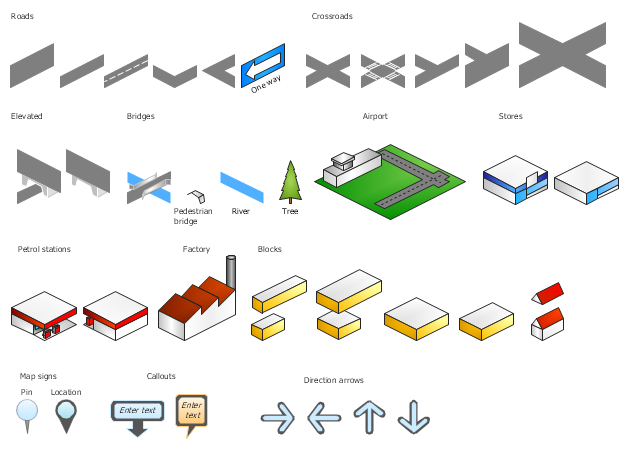
The vector stencils library "3D directional maps" contains 40 symbols for creating pictorial maps, street maps, locator maps, transit maps, tourist maps with points of interest (POI), road maps and route maps using the ConceptDraw PRO diagramming and vector drawing software.
"Pictorial maps are a category of maps that are also loosely called illustrated maps, panoramic maps, perspective maps, bird’s-eye view maps and Geopictorial maps amongst others. In contrast to the regular road map, Atlas or topographic cartography, pictorial maps depict a given territory with a more artistic rather than technical style. The cartography can be a sophisticated 3-D perspective landscape or a simple map graphic enlivened with illustrations of buildings, people and animals. They can feature all sorts of varied topics like historical events, legendary figures or local agricultural products and cover anything from an entire continent to a college campus. ...
Pictorial maps usually show an area as if viewed from above at an oblique angle. They are not generally drawn to scale in order to show street patterns, individual buildings, and major landscape features in perspective. While regular maps focus on the accurate rendition of distances, pictorial maps enhance landmarks and often incorporate a complex interplay of different scales into one image in order to give the viewer a more familiar sense of recognition." [Pictorial maps. Wikipedia]
The design elements library "3D directional maps" is included in the Directional Maps solution from the Maps area of ConceptDraw Solution Park.
3D pictorial map symbols
- Flowcharts | Class Diagram For Agriculture Management System
- Marketing Diagrams | Area Charts | Dfd For Agriculture Management ...
- Er Diagram Of Agriculture Information System
- Example of DFD for Online Store (Data Flow Diagram ) | UML Use ...
- ER Diagram For Agricultural Management System
- Er Diagram Of Agriculture Management System
- Food security assessment - Flowchart | Flowcharts | Flowchart Of ...
- Uml Diagram Of Farming Management System
- AWS Architecture Diagrams | | Health Food | The Best Uml Diagrams ...
- Flow chart Example. Warehouse Flowchart | Workflow Flowchart ...
- Use Case Diagram For Agriculture Management System
- | Er Diagram For E Farming
- Rack Diagrams | Expanded Data Flow To Show All The Processes ...
- Example of DFD for Online Store (Data Flow Diagram ) | Bar ...
- AWS Architecture Diagrams | Block Diagrams | Education ...
- Flow chart Example. Warehouse Flowchart | Marketing Diagrams ...
- Example of DFD for Online Store (Data Flow Diagram ) DFD ...
- Example of DFD for Online Store (Data Flow Diagram ) | Flowcharts ...
- Example of DFD for Online Store (Data Flow Diagram ) | Design ...
- Bar Chart Related To Agriculture Images