Line Chart
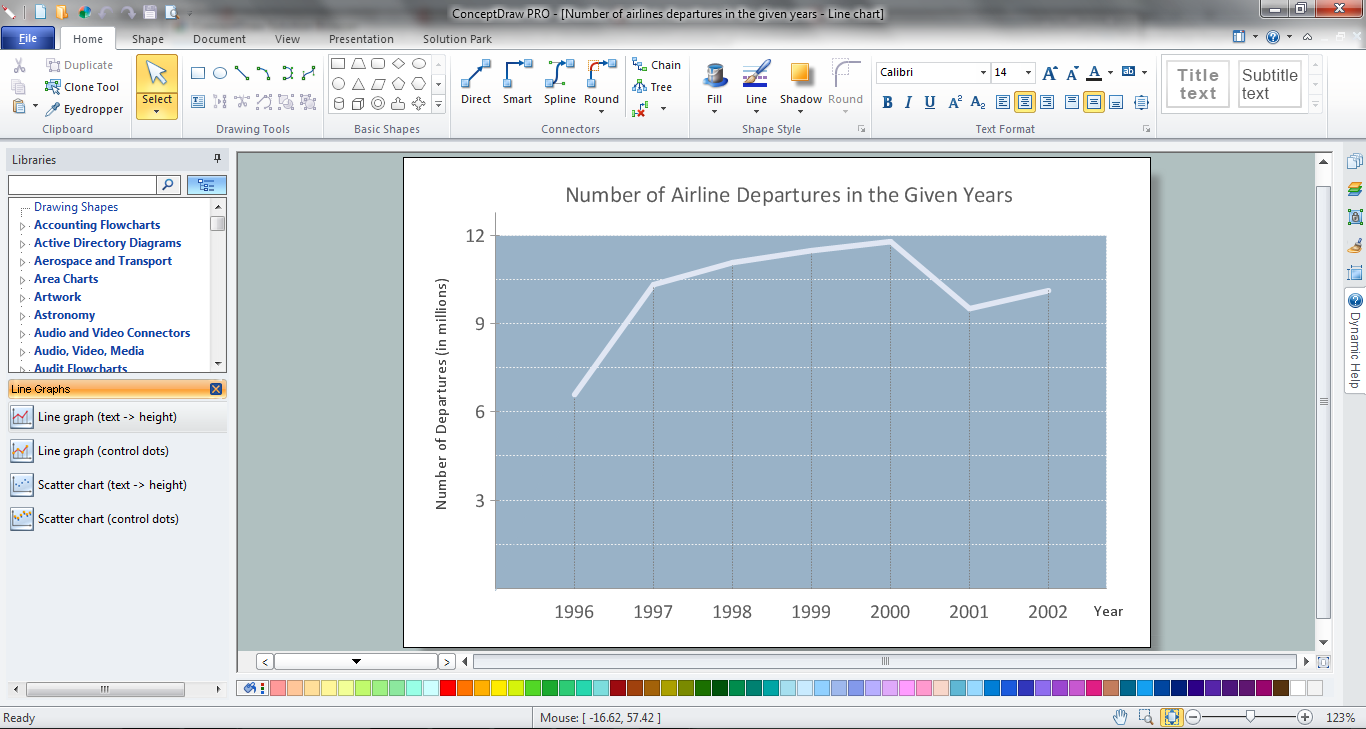
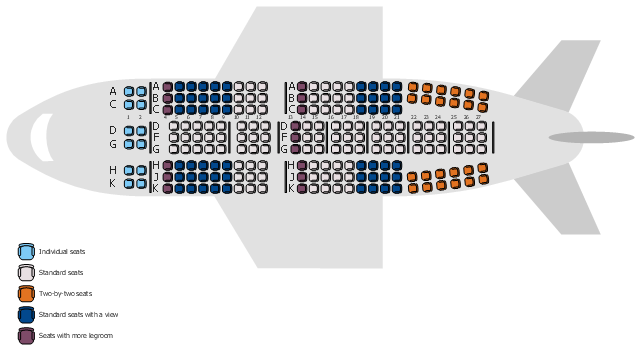
You want to draw the Line Chart and need the automated tool? Now it is reality with Line Graphs solution from Graphs and Charts area of ConceptDraw Solution Park.This airplane seat plan sample shows the seat layout inside the passenger aircraft.
"An aircraft seat map or seating chart, is a diagram of the seat layout inside a passenger aircraft. They are often published by airlines for informational purposes, and are of use to passengers for selection of their seat at booking or check-in.
Seat maps usually indicate the basic seating layout, the numbering and lettering of the seats, the location of the emergency exits, lavatories, galleys, bulkheads and wings. Airlines which allow internet check-in frequently present a seat map indicating free and occupied seats to the passenger so that they select their seat from it." [Aircraft seat map. Wikipedia]
The aircraft seat map example "Airplane seat plan" was created using the ConceptDraw PRO diagramming and vector drawing software extended with the Seating Plans solution from the Building Plans area of ConceptDraw Solution Park.
Line Charts
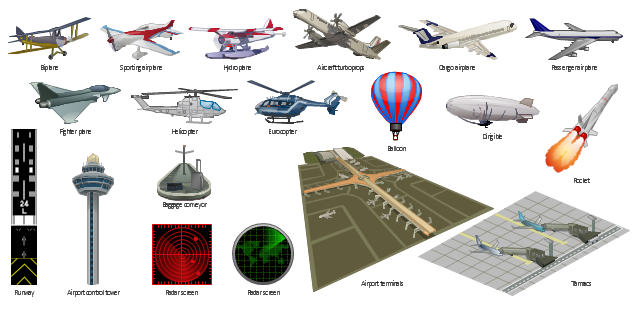
ConceptDraw DIAGRAM diagramming and vector drawing software extended with Line Graphs solution from the Graphs and Charts area of ConceptDraw Solution Park is the best for drawing the Line Charts simply and fast.The vector clipart library Aircraft contains 19 images of aerial vehicles and aviation objects. Use the vector stencils library Aircraft to draw aviation illustrations, presentation slides, infographics and diagrams using the ConceptDraw PRO diagramming and vector drawing software. "Civil aviation is one of two major categories of flying, representing all non-military aviation, both private and commercial. Most of the countries in the world are members of the International Civil Aviation Organization (ICAO) and work together to establish common standards and recommended practices for civil aviation through that agency. Civil aviation includes two major categories: - Scheduled air transport, including all passenger and cargo flights operating on regularly scheduled routes; and - General aviation (GA), including all other civil flights, private or commercial. ... Some countries also make a regulatory distinction based on whether aircraft are flown for hire like: - Commercial aviation includes most or all flying done for hire, particularly scheduled service on airlines; and - Private aviation includes pilots flying for their own purposes (recreation, business meetings, etc.) without receiving any kind of remuneration. All scheduled air transport is commercial, but general aviation can be either commercial or private. Normally, the pilot, aircraft, and operator must all be authorized to perform commercial operations through separate commercial licensing, registration, and operation certificates." [Civil aviation. Wikipedia] The design elements library Aircraft is included in the Aerospace and Transport solution from the Illustration area of ConceptDraw Solution Park.
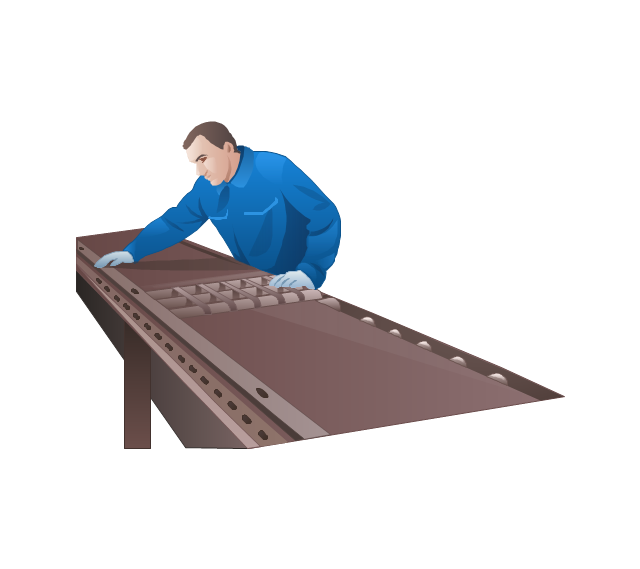
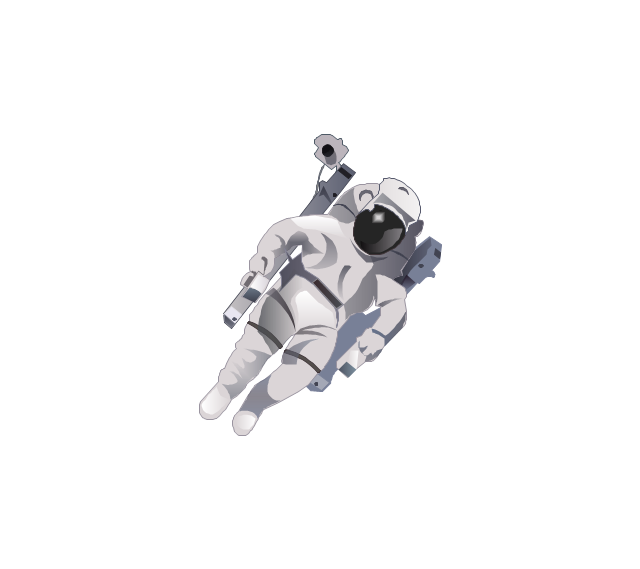
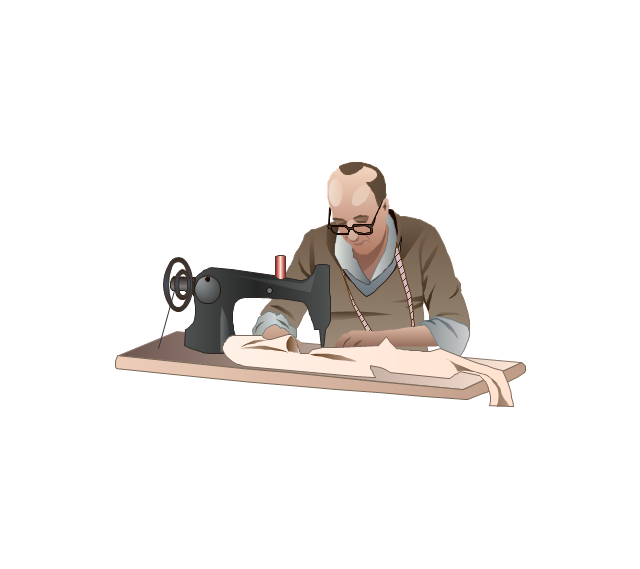
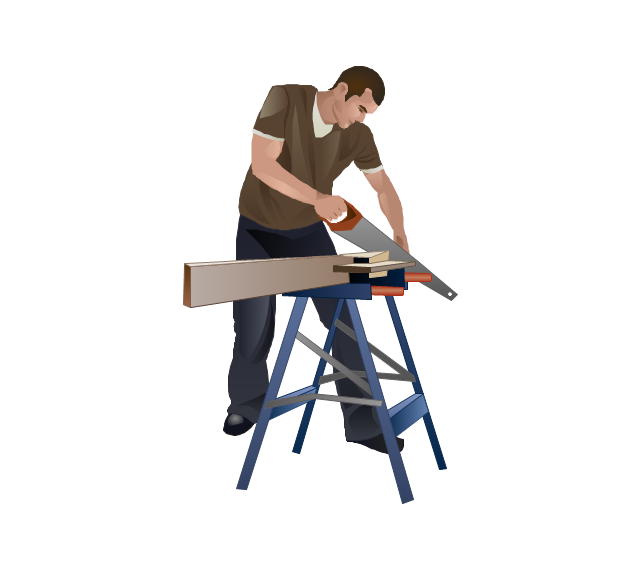
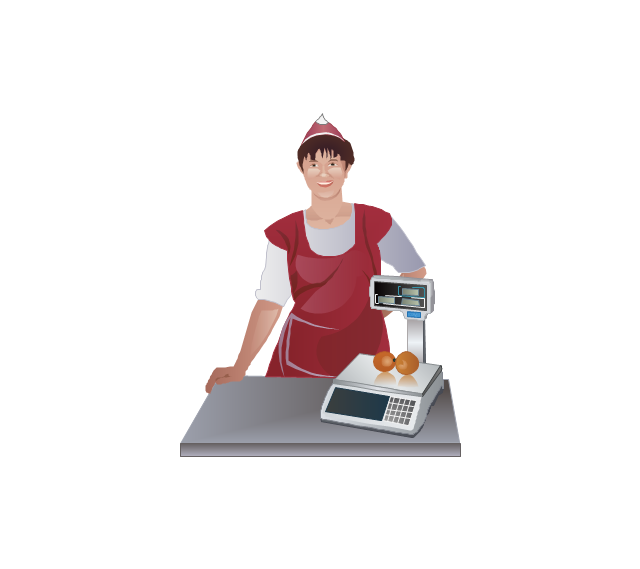
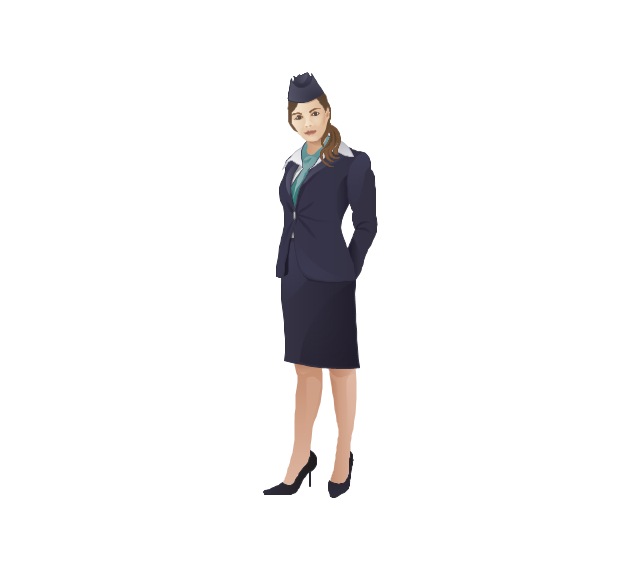
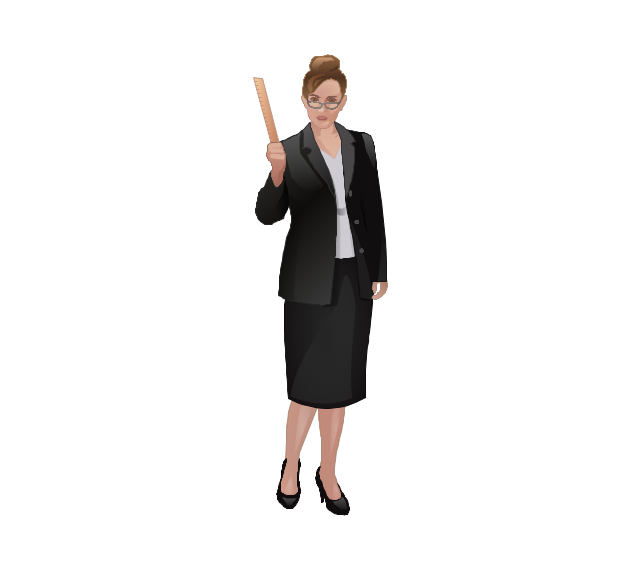
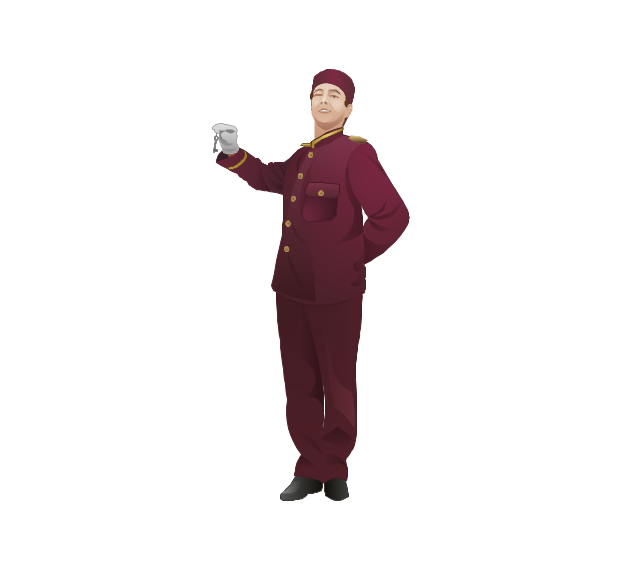
The vector stencils library "Professions" contains 58 people clipart images of different professions you can use in your presentations, illustrations and infographics.
"Electronic clip art is available in several different file formats. It is important for clip art users to understand the differences between file formats so that they can use an appropriate image file and get the resolution and detail results they need.
Clip art file formats are divided into 2 different types: bitmap or vector graphics. ...
In contrast to the grid format of bitmap images, Vector graphics file formats use geometric modeling to describe an image as a series of points, lines, curves, and polygons. Because the image is described using geometric data instead of fixed pixels, the image can be scaled to any size while retaining "resolution independence", meaning that the image can be printed at the highest resolution a printer supports, resulting in a clear, crisp image. Vector file formats are usually superior in resolution and ease of editing as compared to bitmap file formats, but are not as widely supported by software and are not well-suited for storing pixel-specific data such as scanned photographs. In the early years of electronic clip art, vector illustrations were limited to simple line art representations." [Clip art. Wikipedia]
The clip art example "Professions - Vector stencils library" was created using the ConceptDraw PRO diagramming and vector drawing software extended with the People solution from the Illustration area of ConceptDraw Solution Park.
www.conceptdraw.com/ solution-park/ illustrations-people
 Audit Flowcharts
Audit flowcharts solution extends ConceptDraw DIAGRAM software with templates, samples and library of vector stencils for drawing the audit and fiscal flow charts.
 Line Graphs
How to draw a Line Graph with ease? The Line Graphs solution extends the capabilities of ConceptDraw DIAGRAM with professionally designed templates, samples, and a library of vector stencils for drawing perfect Line Graphs.
Chart Templates
Easy charting software comes with beautiful chart templates and examples. This makes it easy to create professional charts without prior experience.Line Chart Examples
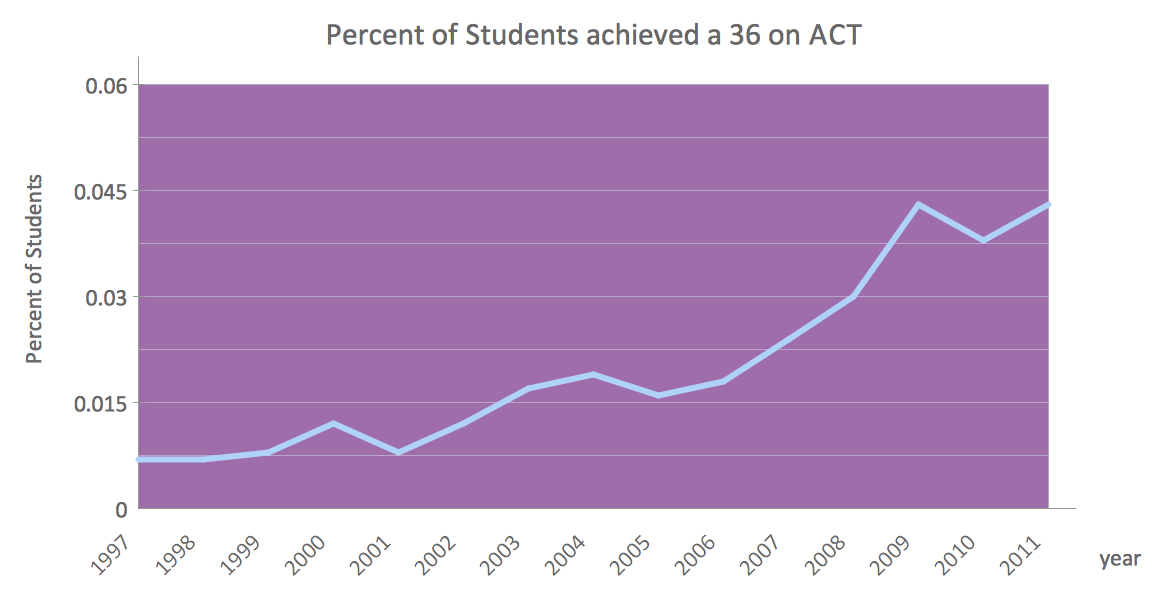
The Line Graphs solution from Graphs and Charts area of ConceptDraw Solution Park contains a set of examples, templates and design elements library of line and scatter charts. Use it to draw line and scatter graphs using ConceptDraw DIAGRAM diagramming and vector drawing software for illustrating your documents, presentations and websites.Chart Examples
Easy charting software comes with beautiful chart templates and examples. This makes it easy to create professional charts without prior experience.This hotel computer reservations system cycle process chart example was redesigned from the Wikimedia Commons file: По-запросу.jpg.
[commons.wikimedia.org/ wiki/ File:По-запросу.jpg]
"A computer reservations system or central reservation system (CRS) is a computerized system used to store and retrieve information and conduct transactions related to air travel, hotels, car rental, or activities. ...
Modern GDSes typically allow users to book hotel rooms, rental cars, airline tickets as well as activities and tours." [en.wikipedia.org/ wiki/ Computer_ reservations_ system]
The cycle process diagram example "Hotel reservation system" was created using the ConceptDraw PRO diagramming and vector drawing software extended with the Sales Flowcharts solution from the Marketing area of ConceptDraw Solution Park.
"Porter five forces analysis is a framework for industry analysis and business strategy development. It draws upon industrial organization (IO) economics to derive five forces that determine the competitive intensity and therefore attractiveness of a market. Attractiveness in this context refers to the overall industry profitability. An "unattractive" industry is one in which the combination of these five forces acts to drive down overall profitability. A very unattractive industry would be one approaching "pure competition", in which available profits for all firms are driven to normal profit.
Three of Porter's five forces refer to competition from external sources. The remainder are internal threats.
Porter referred to these forces as the micro environment, to contrast it with the more general term macro environment. They consist of those forces close to a company that affect its ability to serve its customers and make a profit. A change in any of the forces normally requires a business unit to re-assess the marketplace given the overall change in industry information. The overall industry attractiveness does not imply that every firm in the industry will return the same profitability. Firms are able to apply their core competencies, business model or network to achieve a profit above the industry average. A clear example of this is the airline industry. As an industry, profitability is low and yet individual companies, by applying unique business models, have been able to make a return in excess of the industry average.
Porter's five forces include - three forces from 'horizontal' competition: the threat of substitute products or services, the threat of established rivals, and the threat of new entrants; and two forces from 'vertical' competition: the bargaining power of suppliers and the bargaining power of customers.
This five forces analysis, is just one part of the complete Porter strategic models. The other elements are the value chain and the generic strategies." [Porter five forces analysis. Wikipedia]
The block diagram example "Porter's five forces model" was created using the ConceptDraw PRO diagramming and vector drawing software extended with the Block Diagrams solution from the area "What is a Diagram" of ConceptDraw Solution Park.
Business Process Flowchart Symbols
Business process modeling is known in the corporate world as an excellent tool which can speak. Business process flowcharts, diagrams and maps are used to define the business processes in terms of inputs and outputs, to visually represent and effectively explain complex business processes of an enterprise, and also showcase decisions on a single piece of paper. The process of business process mapping supposes the use of special business process flowchart symbols predefined by Business Process Modeling Notation (BPMN) and taking their roots from the data processing diagrams and programming flow charts. In other words the BPMN standard notation is a common language used for business process design and implementation, that guarantees a clarity of designed Business Process Flowcharts for all business analysts, technical developers and business managers. The ability to create professionally-looking Business Process flowcharts, maps and diagrams, is provided by powerful ConceptDraw DIAGRAM software and the Business Process Mapping solution included to ConceptDraw Solution Park.
 Event-driven Process Chain Diagrams
Event-Driven Process Chain Diagrams solution extends ConceptDraw DIAGRAM functionality with event driven process chain templates, samples of EPC engineering and modeling the business processes, and a vector shape library for drawing the EPC diagrams and EPC flowcharts of any complexity. It is one of EPC IT solutions that assist the marketing experts, business specialists, engineers, educators and researchers in resources planning and improving the business processes using the EPC flowchart or EPC diagram. Use the EPC solutions tools to construct the chain of events and functions, to illustrate the structure of a business process control flow, to describe people and tasks for execution the business processes, to identify the inefficient businesses processes and measures required to make them efficient.
Hybrid Network Topology
A network topology is the topological structure or the arrangement of different elements of computer network. There are several basic types of network topologies, such as star, ring, bus, mesh. But the most popular is a combination of two or more diverse basic network topologies, which is known as hybrid network topology. The examples of hybrid topology are: star-bus, star-ring topologies, etc. Each resulting hybrid topology has its own features, advantages and limitations of its components. Hybrid network topologies are more flexible, reliable, and have increased fault tolerance, the faults in them can be easily diagnosed and corrected, new nodes can be easily added. But at the same time hybrid topologies often are sufficiently expensive and difficult for managing. ConceptDraw DIAGRAM diagramming and vector drawing software supplied with the tools of Computer Network Diagrams solution from Computer and Networks area is perfect for schematic description various types of computer network topologies and easy designing Hybrid network topology diagrams.- Line chart - Number of airlines departures in the given years | Line ...
- Airline Business Processes Flowchart
- Airlines Business Plan
- Swim Lane Diagram Examples Southwest Airlines
- Number of airlines departures in the given years - Line chart | Line ...
- Number of airlines departures in the given years - Line chart ...
- Network Topology In Airlines
- Airline Customer Service With The Help Of Fish Bone Diagram
- Process Flowchart | ATM UML Diagrams | Airline Industry Matrix
- Airlines Maintenance Operations Clipart
- Data Network Routing Airlines Topologies
- Five Forces Analysis Of Airline Industry
- Best Seats On Airlines
- Example Of Value Chain Analysis Of Airlines
- Line Graphs | Chart Examples | Line Chart Examples | Map Mind ...
- Process Flowchart | Data Flow Diagram Of Airline Reservation System
- Bar Diagrams for Problem Solving. Create economics and financial ...
- Airplane seat plan | Aircraft - Design Elements | Aircraft - Vector ...
- Structure Chart For Airline Reservation System
