HelpDesk
How to Create a Fishbone (Ishikawa) Diagram Quickly
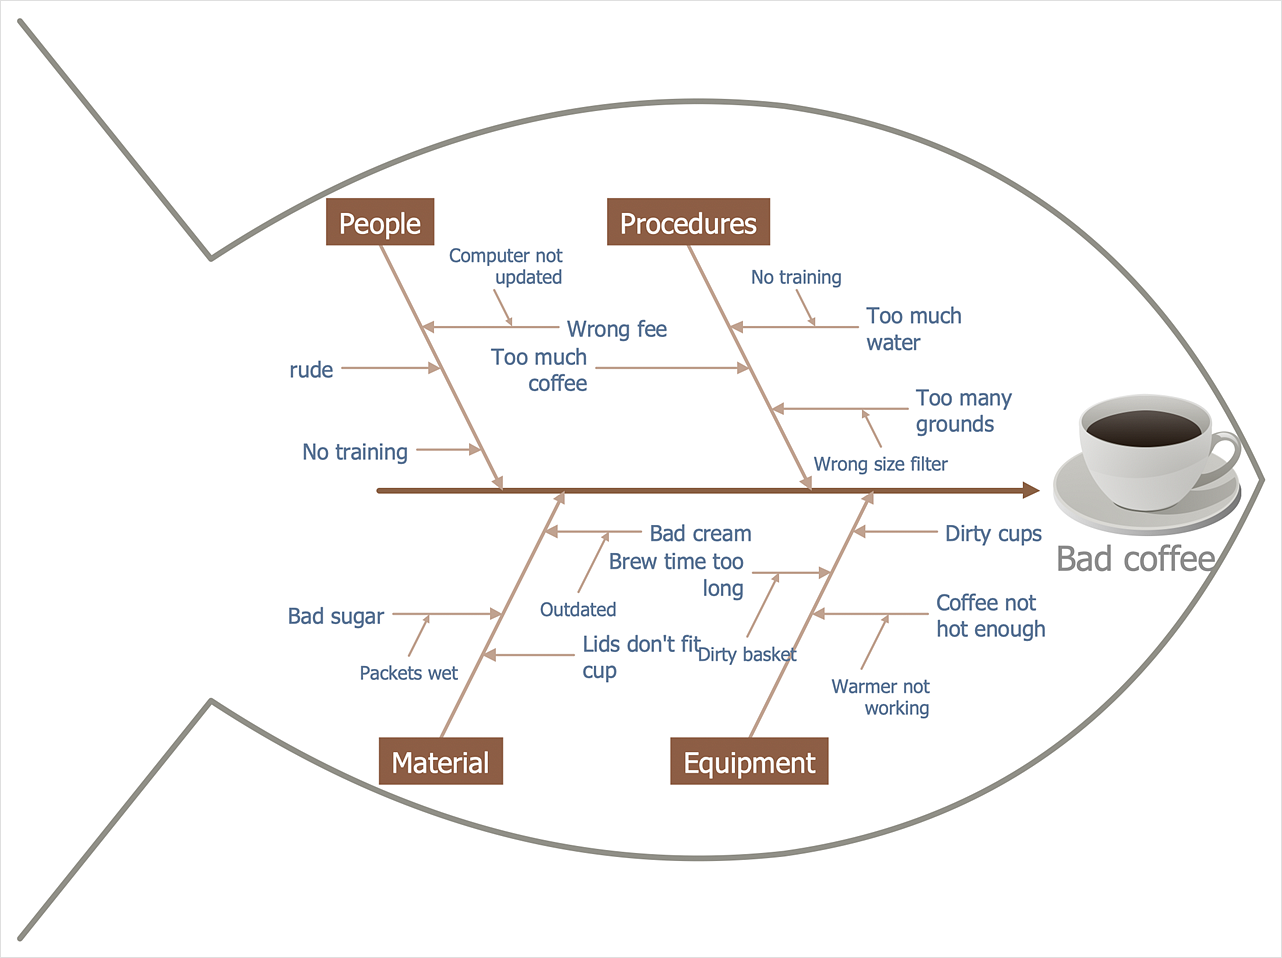
A Fishbone (Ishikawa) diagram is also called cause-and-effect diagram. Fishbone diagram is often used in business to determine the cause of some problem. The diagram illustrates the main causes and sub-causes leading to an event. The main goal of the Fishbone diagram is to illustrate in a graphical way the relationship between a given outcome and all the factors that influence this outcome. The complete diagram resembles a fish skeleton as its name implies. The ability to create a Fishbone Diagram is supported by the Fishbone Diagram solution. Use ConceptDraw MINDMAP for structuring data and then ConceptDraw DIAGRAM for generating a Fishbone Diagram from mind map structure.Flowchart
The Flowcharts are widespread in various fields and include the multitude of types. They are dedicated to representation the algorithms, processes, workflows of any complexity in a clear and intuitive format. The Flowcharts are commonly used in software development as a visual tool for illustration algorithms and logic of computer programs, in business for illustration business scenarios, in education, and so on. For drawing the Flowchart are used the special object blocks, among them rectangle or box used to represent an activity or step, rounded box or oval to depict Start / End, diamond to represent the decision point (involves the branching yes/no), circle used to represent the point of connection, parallelogram to represent the Input / Output, and some others. With ConceptDraw DIAGRAM including Flowcharts solution it is easy to create professional-looking Flowchart diagrams of any complexity and any degree of detailing. Succeed in drawing the Flowcharts using quick-start templates, predesigned samples and extensive libraries of ready-made flowchart symbols, blocks and icons.HelpDesk
How to Draw a Fishbone Diagram
Fishbone (Ishikawa) Diagram is often used in business to determine the cause of some problem. A Fishbone diagram is also called the cause-and-effect diagram. The main goal of the Fishbone diagram is to illustrate in a graphical way the relationship between a given outcome and all the factors that influence this outcome. The complete diagram resembles a fish skeleton as its name implies. Cause and Effect analysis is used in management to identify the possible causes of a problem in order to eliminate them. The ability to create a Fishbone Diagram is supported by the Fishbone Diagram solution.
 Website Wireframe
The innovative Website Wireframe solution enhances the ConceptDraw DIAGRAM functionality with newest wireframe tools, libraries with variety of predesigned icons, symbols, buttons, graphics, forms, boxes, and many other vector elements, templates and professionally designed samples, which make it the best wireframing software. Website Wireframe solution gives you significant advantages when designing and maintaining websites, creating skeletal and content-free depictions of website structure, making website prototypes and planning the content arrangement before committing to design, also speeds up the processes of sketching, producing and sharing wireframe examples of website style and interface design.
The vector stencils library "Education pictograms" contains 128 education pictograms. Use this flat icon set to design your educational infogram in ConceptDraw PRO diagramming and vector drawing software.
The vector stencils library "Education pictograms" is included in the Education Infographics solution from the Business Infographics area of ConceptDraw Solution Park.
The vector stencils library "Education pictograms" is included in the Education Infographics solution from the Business Infographics area of ConceptDraw Solution Park.
 Winter Sports
The Winter Sports solution from Sport area of ConceptDraw Solution Park contains winter sports illustration examples, templates and vector clipart libraries.
- Basic Flowchart Symbols and Meaning | Euclidean algorithm ...
- Block diagram - Customer decision making | Basic Flowchart ...
- Decision Making Models Block Diagram Of Mgmt
- Basic Flowchart Symbols and Meaning | Process Flowchart | How to ...
- Block diagram - Customer decision making | Block Diagrams | Block ...
- Basic Flowchart Symbols and Meaning | Process Flowchart | Flow ...
- Decision Making | Block diagram - Customer decision making ...
- Basic Flowchart Symbols and Meaning | Simple Flow Chart | How to ...
- Basic Flowchart Symbols and Meaning | Flowchart design ...
- Basic Flowchart Symbols and Meaning | Simple Flow Chart ...
- Basic Flowchart Symbols and Meaning | Process Flowchart ...
- Simplest Flow Chart
- Influence Diagram Software | Influence Diagram | Types of ...
- CERES data flow diagram | Sun Solar System | Education ...
- Fishbone Diagram | Fishbone Diagrams | How to Draw a Fishbone ...
- Design elements - Education backgrounds | Education pictograms ...
- Hunting and fishing license sales flowchart | Map symbols - Vector ...
- Process Flowchart | Seven Management and Planning Tools ...
- Flow chart Example. Warehouse Flowchart | How to Deliver a ...
- How to Create a Fishbone (Ishikawa) Diagram Quickly | Fishbone ...


