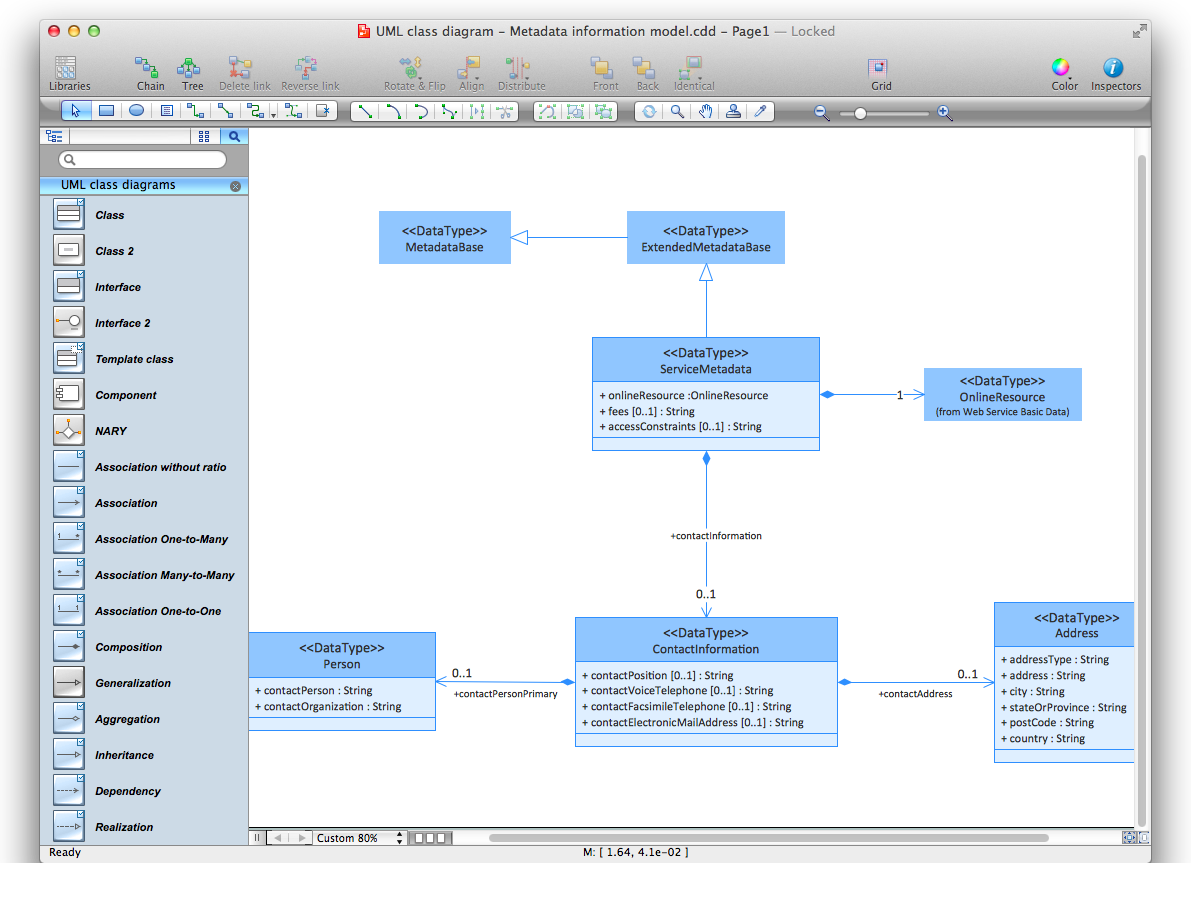
UML Class Diagrams. Diagramming Software for Design UML Diagrams
In software engineering, a UML Class Diagrams is a type of static structure diagram that is used both for general conceptual modeling of the systematics of the application, and for detailed modeling translating the models into programming code. Use ConceptDraw DIAGRAM with UML class diagram templates, samples and stencil library from Rapid UML solution to show the classes of system, their attributes, operations or methods, and the relationships among the classes.
Diagramming Software for Design UML Collaboration Diagrams
ConceptDraw helps you to start designing your own UML Collaboration Diagrams with examples and templates.
Block Diagram
The vector stencils libraries: Block Diagrams, Blocks with Perspective, Callouts, Connectors, Raised Blocks from the solution Block Diagrams contain specific block diagram symbols such as arrows, input/output symbols, start/end symbols, processing symbols, conditional symbols, commenting symbols, callouts, connectors, etc. for ConceptDraw DIAGRAM diagramming and vector drawing software. The Block Diagrams solution is contained in a "Diagrams" area of ConceptDraw Solution Park. Use the libraries from the Block Diagrams solution to draw block diagrams for your business documents, presentations and websites in a few minutes.Diagramming Software for Design UML Package Diagrams
UML Package Diagram illustrates the functionality of a software system.
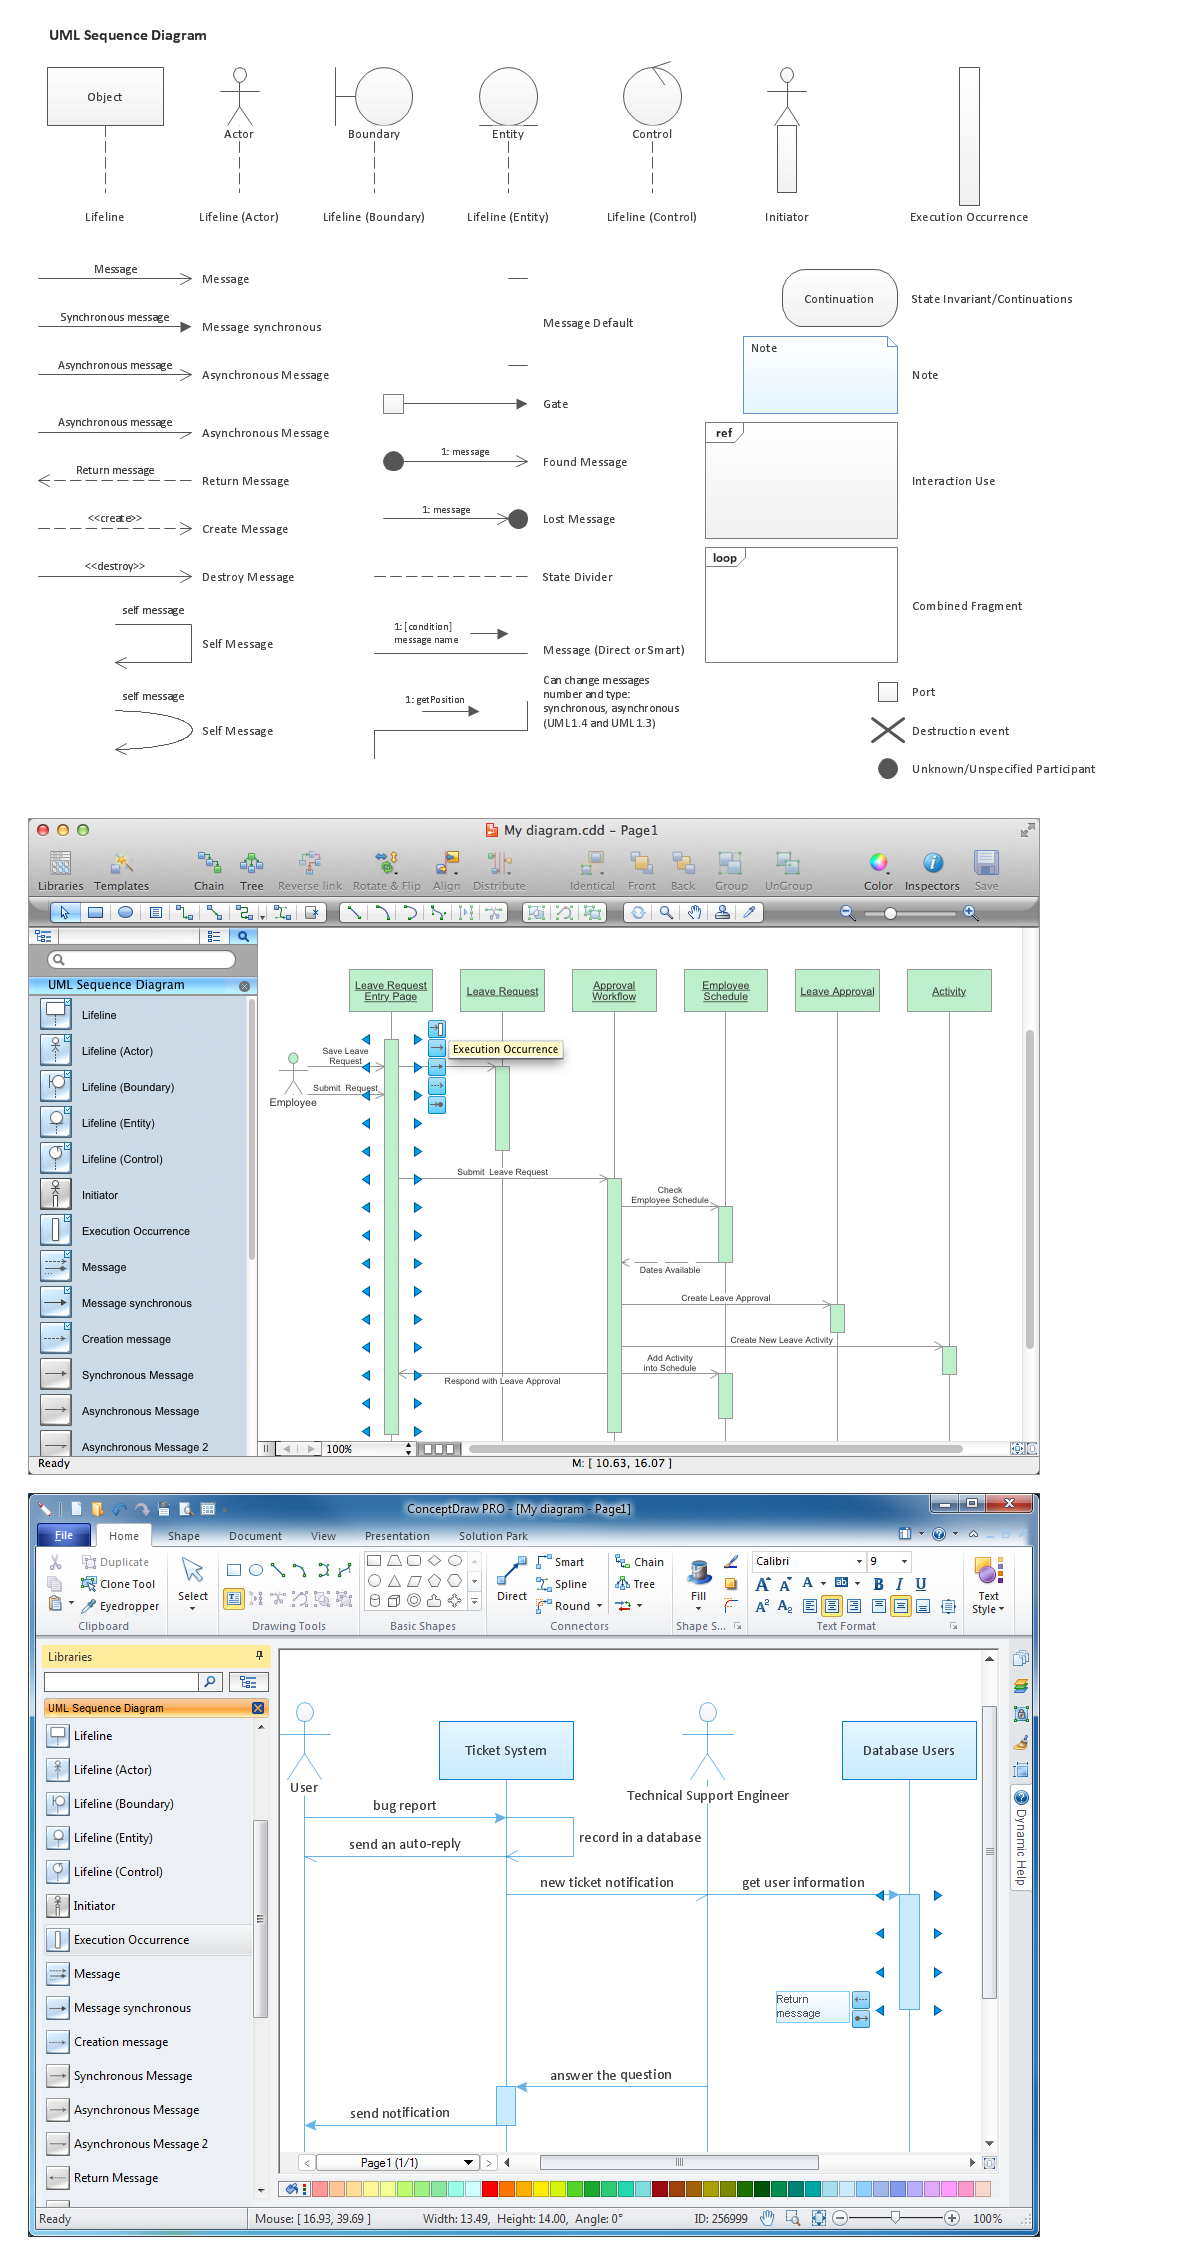
Diagramming Software for designing UML Sequence Diagrams
Sequence Diagrams shows how objects communicate with each other in terms of a sequence of messages. Also indicates the lifespans of objects relative to those messages.
UML Deployment Diagram. Diagramming Software for Design UML Diagrams
Deployment diagram describes the hardware used in system implementations and the execution environments and artifacts deployed on the hardware.
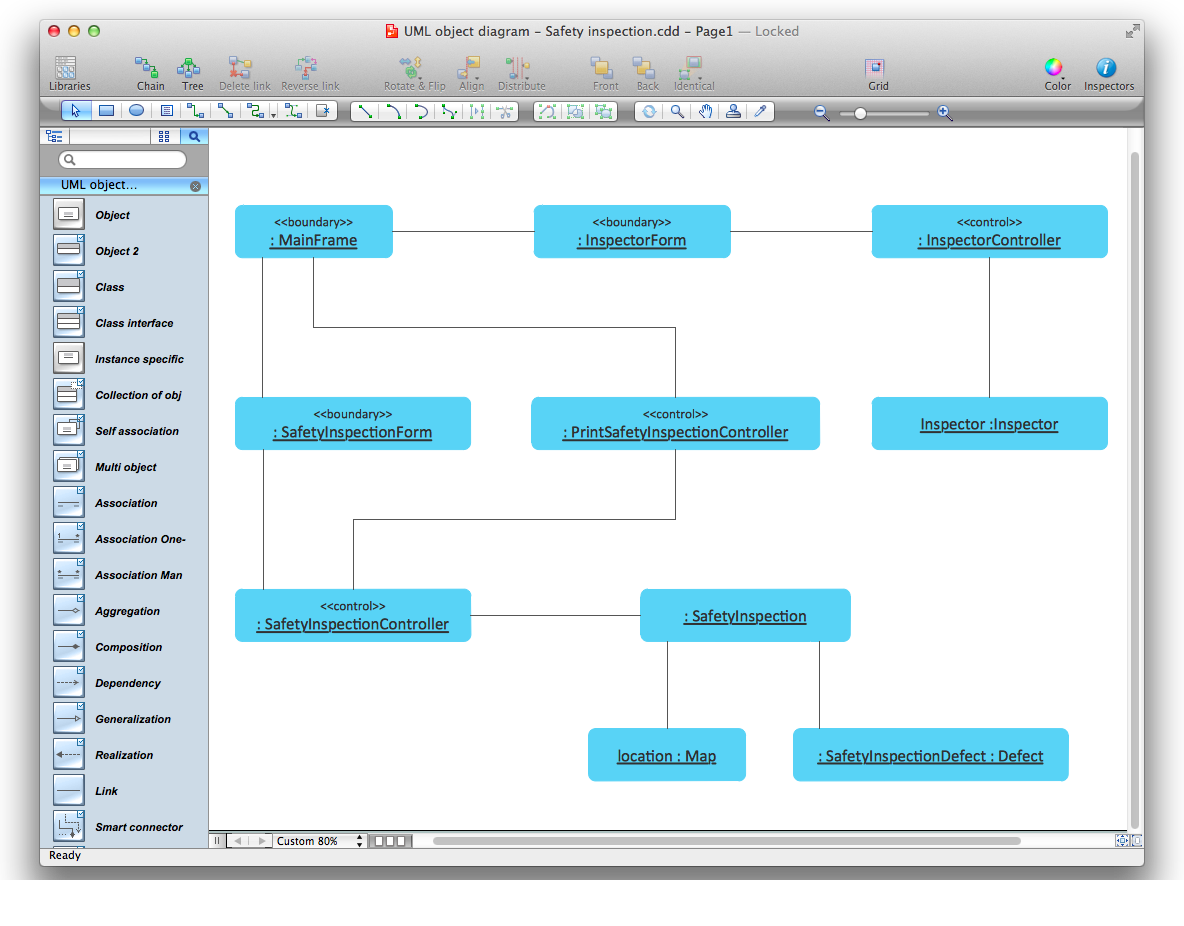
Diagramming Software for Design UML Object Diagrams
UML Object Diagram shows the structure of a modeled system at a specific time. ConceptDraw Rapid UML solution delivers libraries contain pre-designed objects fit UML notation, and ready to draw professional UML Object Diagram.
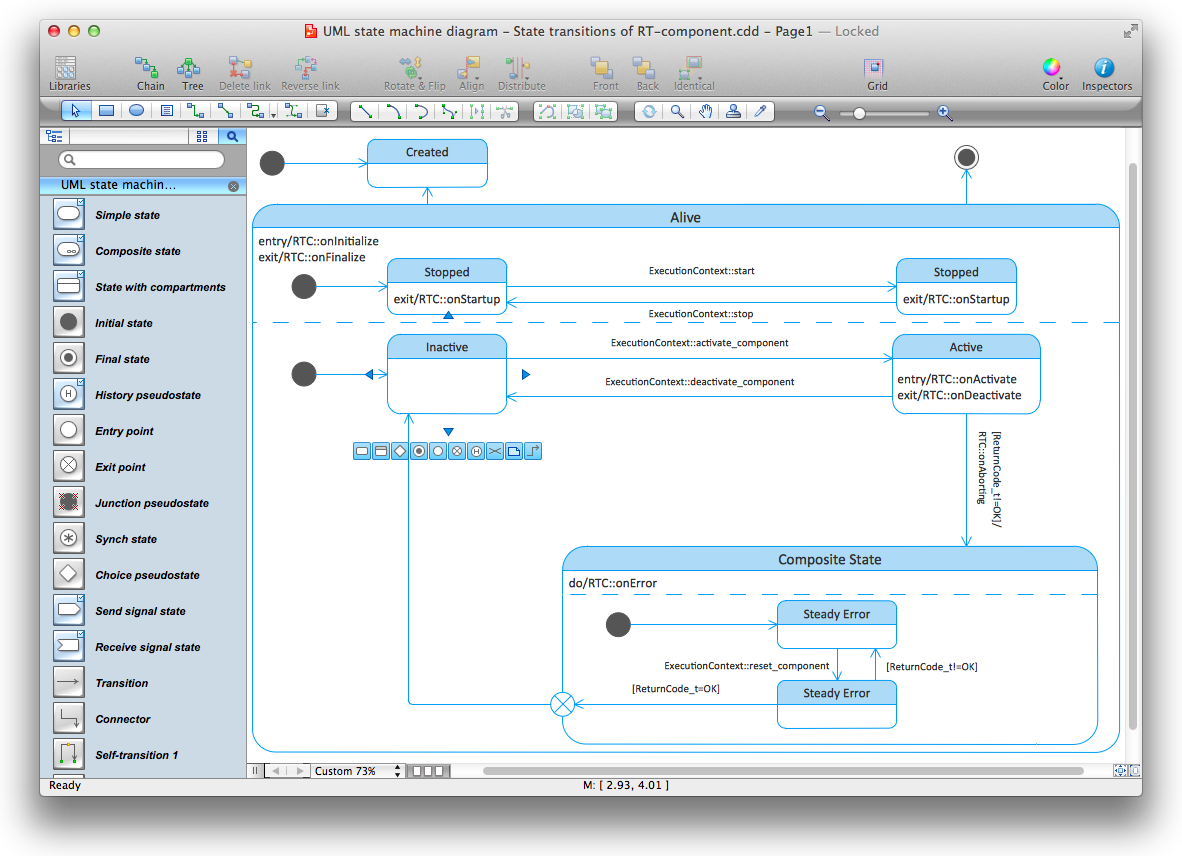
Diagramming Software for Design UML State Machine Diagrams
UML state machine's goal is to overcome the main limitations of traditional finite-state machines while retaining their main benefits.
UML Class Diagram Generalization Example UML Diagrams
This sample was created in ConceptDraw DIAGRAM diagramming and vector drawing software using the UML Class Diagram library of the Rapid UML Solution from the Software Development area of ConceptDraw Solution Park. This sample describes the use of the classes, the generalization associations between them, the multiplicity of associations and constraints. Provided UML diagram is one of the examples set that are part of Rapid UML solution.ER Diagram Tool
Creating of Entity-Relationship Diagrams (ERDs) is a complex process that requires convenient, automated tools. ConceptDraw DIAGRAM diagramming and vector drawing software offers a powerful ER Diagram Tool - the Entity-Relationship Diagram (ERD) Solution from the Software Development Area.
 IDEF0 Diagrams
IDEF0 Diagrams visualize system models using the Integration Definition for Function Modeling (IDEF) methodology. Use them for analysis, development and integration of information and software systems, and business process modelling.
Entity Relationship Diagram - ERD - Software for Design Chen ER Diagrams
The Entity-Relationship Diagram (ERD) solution from ConceptDraw Solution Park extends ConceptDraw DIAGRAM ector graphics and diagramming software with the ability to describe a database using the Entity-Relationship (Chen) model. Use it for design your ERDs and verify that ConceptDraw DIAGRAM offers the best ERD diagrams software tools for design element Chen notation.Diagramming Software for Design UML Activity Diagrams
Activity diagram describes the business and operational step-by-step workflows of components in a system. An activity diagram shows the overall flow of control.
Diagramming Software for Design UML Use Case Diagrams
Use Case Diagrams describes the functionality provided by a system in terms of actors, their goals represented as use cases, and any dependencies among those use cases.
Entity Relationship Diagram - ERD - Software for Design Crows Foot ER Diagrams
ER-model is a data model which lets describe the conceptual schemes in a specific subject area. It can help to highlight the key entities and specify relationships that can be established between these entities. During the database design, it is realized the transformation of ER model into certain database scheme based on the chosen data model (relational, object, network, etc.). There are used two notations for ERDs: Crow's Foot and Chen's. Crow's Foot notation proposed by Gordon Everest represents the entity by rectangle containing its name (name must be unique within this model), and relation - by the line which links two entities involved in relationship. The relationship's plurality is graphically indicated by a "plug" on the end of the link, the optionality - by a circle. Entity-Relationship Diagrams based on Crow's Foot notation can be easily drawn using the ConceptDraw DIAGRAM. Extended with Entity-Relationship Diagram (ERD) solution, it is the best ERD diagrams software with powerful tools and ready design elements for Crow's Foot and Chen notations.
Entity Relationship Diagram Software for Mac
Great part of modern approaches to the database design are based on the use of different versions of ER-models. The important feature of entity-relationship model is that it can be visually represented as a graphical diagram. ER-models and Entity Relationship Diagrams are so popular due to the simplicity and the presentation clarity. The conceptual basis led to their widespread use in CASE-systems, which support automatic design of relational databases. The typical concepts for ER-models are entity, relation and attribute. Relation is a graphically represented association between two entities, that establishes certain rules and all instances of the linked entity types are subject to these rules. In common ER-model this association is always binary. For representing entity-relationship elements, there are used Crow’s foot and Chen notations. ConceptDraw DIAGRAM is a famous Entity Relationship Diagram software for Mac OSX which gives the ability to describe visually the databases with Chen’s and Crow’s Foot notation icons from Entity-Relationship Diagram (ERD) solution.Diagramming Software for Design UML Object Diagrams
UML Object Diagram shows the structure of a modeled system at a specific time. ConceptDraw Rapid UML solution delivers libraries contain pre-designed objects fit UML notation, and ready to draw professional UML Object Diagram.
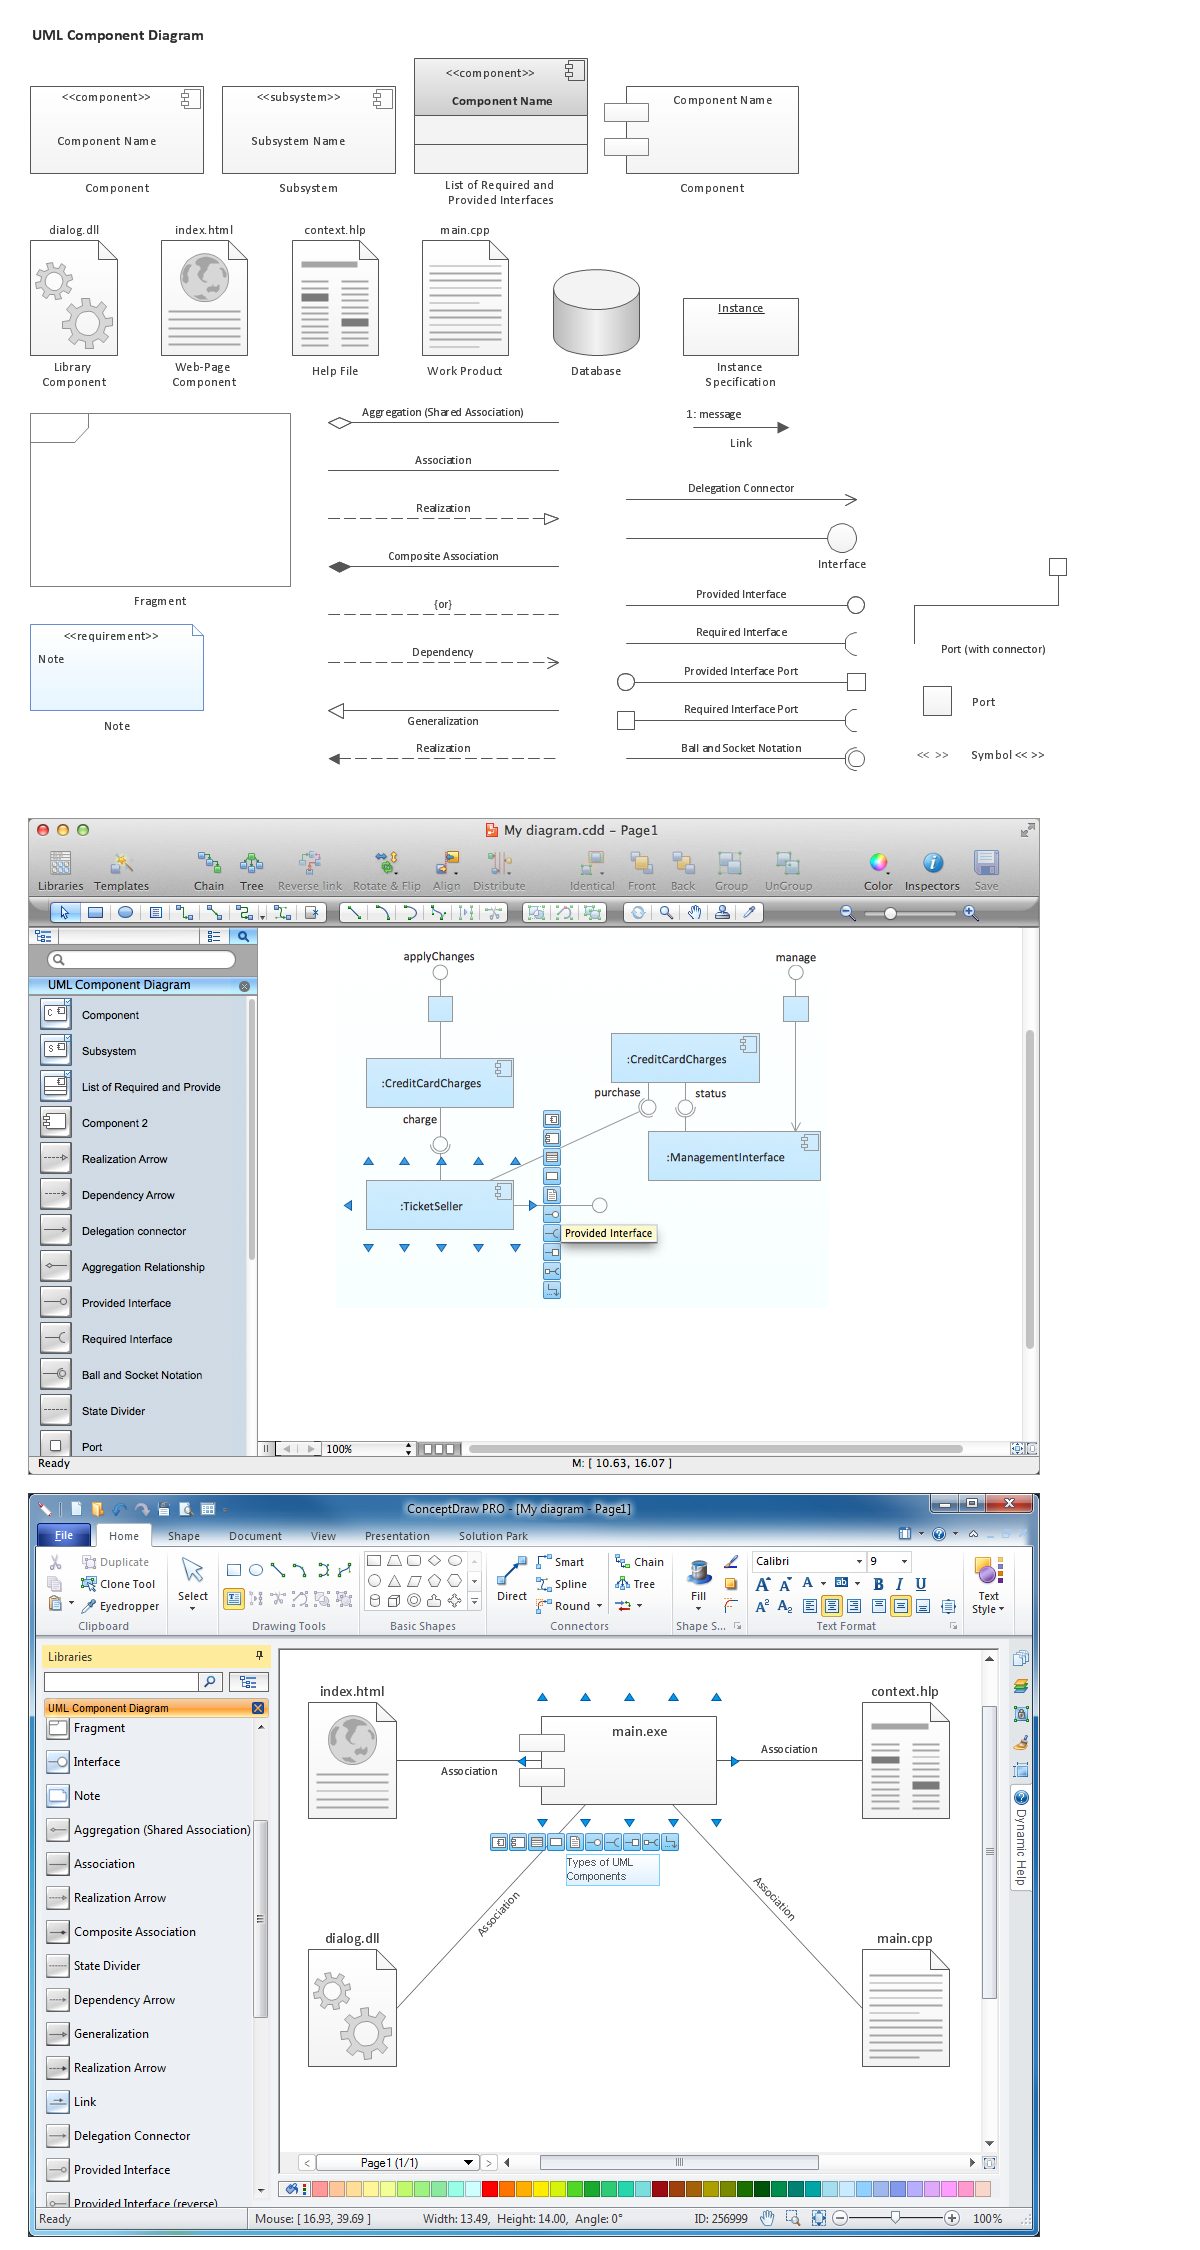
Diagramming Software for Design UML Component Diagrams
UML Component Diagram illustrate how components are wired together to larger components and software systems that shows the structure of arbitrarily complex systems. ConceptDraw Rapid UML solution delivers libraries contain pre-designed objects fit UML notation, and ready to draw professional UML Component Diagram.
How to Draw a Computer Network Diagrams
ConceptDraw DIAGRAM enhanced with popular Computer Network Diagrams solution from Computer and Networks area of ConceptDraw Solution Park is a powerful vector graphics and computer network diagramming software. It includes templates, samples and 7 libraries with predesigned vector objects of computer network devices, computer peripheral devices, network hardware, external digital devices, internet symbols, logical symbols, to help IT professionals easily visualize network equipment, to draft and present computer and network installations. It assists create easy and even instantly Computer Network Diagrams of various types and complexity, design Wireless Network Schemes, Network Topologies Diagrams, Computer Network System Designs. The list of five the most popular practical applications of Computer Network Diagrams solution includes documentation, presentations, training, workflows, education. A represented video How to Draw a Computer Network Diagram will help to realize effectively your computer network design process.
 Network Layout Floor Plans
Network Layout Floor Plans solution extends ConceptDraw DIAGRAM software functionality with powerful tools for quick and efficient documentation the network equipment and displaying its location on the professionally designed Network Layout Floor Plans. Never before creation of Network Layout Floor Plans, Network Communication Plans, Network Topologies Plans and Network Topology Maps was not so easy, convenient and fast as with predesigned templates, samples, examples and comprehensive set of vector design elements included to the Network Layout Floor Plans solution. All listed types of plans will be a good support for the future correct cabling and installation of network equipment.
- Entity Relationship Diagram Software Engineering | Entity ...
- How To Make Chen ER Diagram | Entity Relationship Diagram ...
- Entity Relationship Diagram Software Engineering | Entity ...
- Software Development Flow Diagram
- Entity Relationship Diagram Software Engineering | Components of ...
- ERD Symbols and Meanings | Design elements - ERD (crow's foot ...
- Design Element: Chen for Entity Relationship Diagram - ERD | Entity ...
- Local area network (LAN). Computer and Network Examples ...
- Entity Relationship Diagram Software Free Download
- UML Diagram | Communication Diagram UML2.0 / Collaboration ...
- ERD Symbols and Meanings | Components of ER Diagram | ER ...
- ER Daigram In Software Engineering Pdf
- ERD Symbols and Meanings | Entity Relationship Diagram Symbols ...
- Components of ER Diagram | Entity Relationship Diagram - ERD ...
- Entity Relationship Diagram Software Engineering | ERD Symbols ...
- UML activity diagram - Cash withdrawal from ATM | ATM UML ...
- Data Flow Diagrams (DFD) | Dfd In Software Engineering Pdf
- Martin ERD Diagram | Entity Relationship Diagram Symbols | ER ...
- Data Flow Diagram (DFD) | Process Flowchart | Business Process ...





_Win_Mac.png)


_Win_Mac.png)

