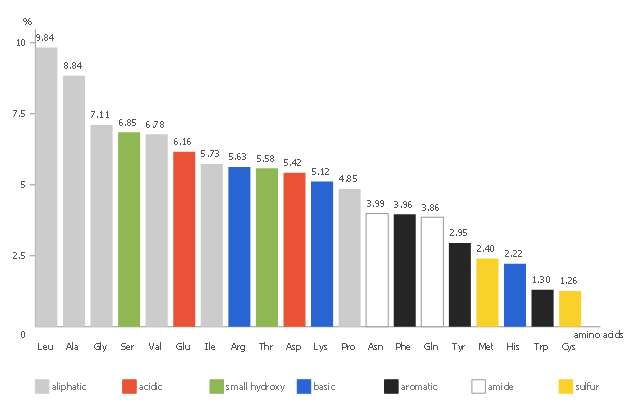
This vertical bar chart sample shows the amino acid composition in percent for the complete UniProtKB/ TrEMBL protein database release 2016_ 07. It was designed using statistic data from the website of UniProt protein sequence database. [ebi.ac.uk/ uniprot/ TrEMBLstats]
"The mission of UniProt is to provide the scientific community with a comprehensive, high quality and freely accessible resource of protein sequence and functional information." [ebi.ac.uk/ uniprot]
The column chart example "Amino acid composition of complete UniProt database" was created using the ConceptDraw PRO diagramming and vector drawing software extended with the Bar Graphs solution from the Graphs and Charts area of ConceptDraw Solution Park.
 Bar Graphs
The Bar Graphs solution enhances ConceptDraw PRO v10 functionality with templates, numerous professional-looking samples, and a library of vector stencils for drawing different types of Bar Graphs, such as Simple Bar Graph, Double Bar Graph, Divided Bar Graph, Horizontal Bar Graph, Vertical Bar Graph, and Column Bar Chart.
Histogram Chart
What is a Histogram Chart? It is a chart which visually displays a distribution of the data. ConceptDraw PRO extended with Histograms solution from the Graphs and Charts area of ConceptDraw Solution Park is the best software for fast and simple drawing professional looking Histogram Chart.Bar Chart Template
These bar chart templates was designed using ConceptDraw PRO diagramming and vector drawing software extended with Bar Graphs solution from Graphs and Charts area of ConceptDraw Solution Park.How To Make a Histogram?
How to make a Histogram quick and easy? ConceptDraw PRO diagramming and vector drawing software extended with Histograms solution from the Graphs and Charts area will effectively help you in Histogram drawing.Column Chart Examples
Column chart examples from ConceptDraw collection can help you find the best visual depiction for you data. You can easily modify column chart examples according to data you want to visualize."Proteins are large biological molecules, or macromolecules, consisting of one or more chains of amino acid residues. Proteins perform a vast array of functions within living organisms, including catalyzing metabolic reactions, replicating DNA, responding to stimuli, and transporting molecules from one location to another. Proteins differ from one another primarily in their sequence of amino acids, which is dictated by the nucleotide sequence of their genes, and which usually results in folding of the protein into a specific three-dimensional structure that determines its activity.
A polypeptide is a single linear polymer chain derived from the condensation of amino acids. The individual amino acid residues are bonded together by peptide bonds and adjacent amino acid residues. The sequence of amino acid residues in a protein is defined by the sequence of a gene, which is encoded in the genetic code." [Protein. Wikipedia]
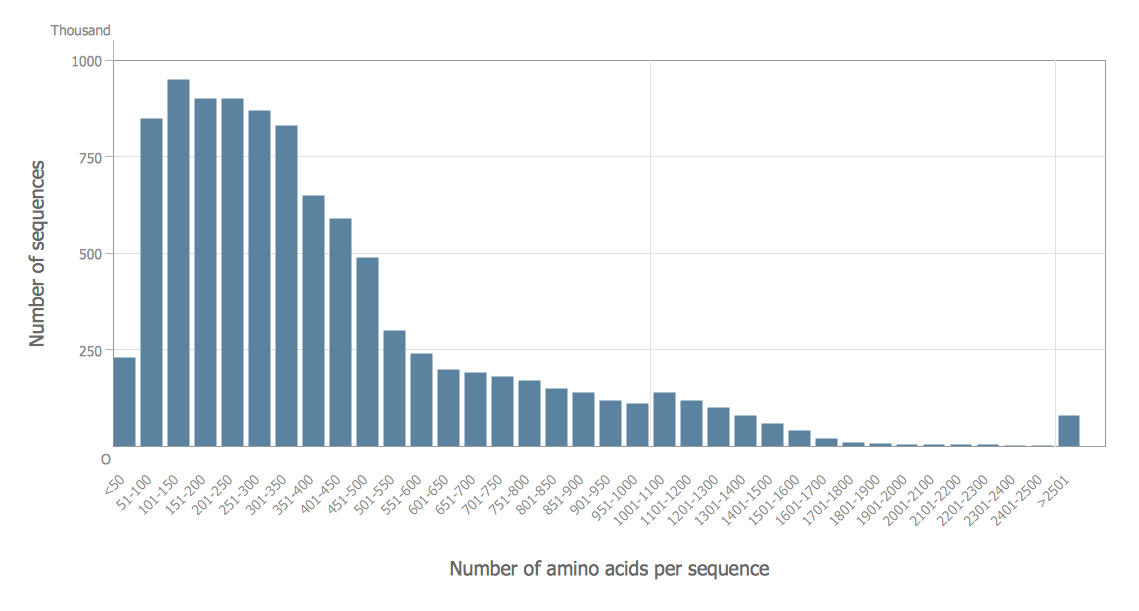
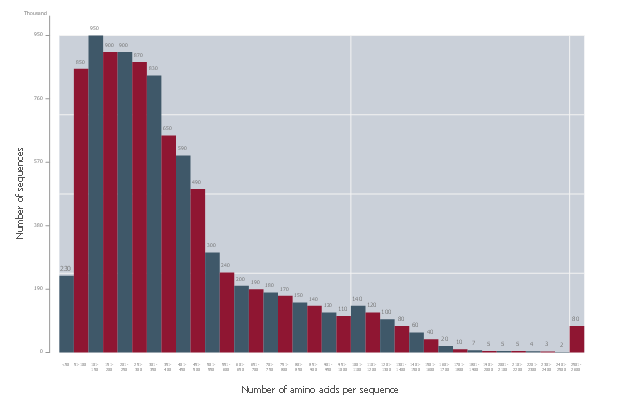
This histogram sample was redesigned from the Wikimedia Commons file: AminoAcid length distribution 2010.svg. [commons.wikimedia.org/ wiki/ File:AminoAcid_ length_ distribution_ 2010.svg]
The histogram example "Amino acid length distribution" was created using the ConceptDraw PRO diagramming and vector drawing software extended with the Histograms solution from the Graphs and Charts area of ConceptDraw Solution Park.
 Basic Histograms
This solution extends the capabilities of ConceptDraw PRO v10.3.0 (or later) with templates, samples and a library of vector stencils for drawing Histograms.
Bar Chart
ConceptDraw PRO extended with Bar Graphs solution from Graphs and Charts area of ConceptDraw Solution Park is ideal software for quick and simple drawing bar chart of any complexity graph.Bar Chart Software
The best bar chart software ever is ConceptDraw. ConceptDraw bar chart software provides an interactive bar charting tool and complete set of predesigned bar chart objects.- Amino Acid Analysis Graphs Pie Chart
- Amino acid length distribution - Histogram | Histogram Chart | How ...
- Fat Of Pyruvic Acid Chart
- Amino Acids Diagram
- Amino acid composition of complete UniProt database
- Design elements - TCA cycle | Flow Chart Of Oxidation ...
- Fat Metabolism Pathway Chart
- Methabolic Pathway Chart
- Protein Metabolism Complete Chart


